Mapping Municipalities at Risk in Puerto Rico
In September 20th in 2017 Hurricane María led to “the biggest failure of American disaster response since Hurricane Katrina struck New Orleans and the Gulf Coast in 2005.” -Daniel Farber (2018)
![]() Data Source: Aerial Image ESRI 2017
Data Source: Aerial Image ESRI 2017
Last September on 2017, Puerto Rico was hit by a category 4 hurricane leaving unprecedented devastation, revealing a deeper crisis, not only economical but highlighting a combination of factors from the physical, social and spatial vulnerabilities that place Puerto Ricans in constant climate risk.The island of Puerto Rico measures 100 x 35 miles approximately with a population that rounds to 3.3 million in 2017 all which experienced a full black-out for months due to wiping out of the central infrastructure be it electrical, water, telecommunications or transportation. Also, the death toll product after the hurricane extended to thousands, public schools have closed, health administration has decreased, and the lack of emergency preparedness and limited resources are constantly threatening local capacity from communities to institutions to respond swiftly. Moreover, Puerto Rico suffered from a lack of effective and immediate response to this catastrophe, with shared responsibilities from the Central Puerto Rican government to the Federal government along with the disparate deployment of the Federal Emergency Management Agency (FEMA) when compared with past events. This catastrophe starts shifting from a natural one to a human-made disaster marking the pertinence of investigating and mapping municipalities at risk.
Puerto Rico´s increasing Debt & Shrinking Population
Source:Banco de Municipio 2017
Hurricane María also resurfaced an economic crisis and population loss that has been building up since 2006 as seen in the line-graphs.Before the hurricane, Puerto Rico was experiencing decades of economic constraints at multiple levels that lead the island default multiple times creating a debt load of $74 billion dollars– systematically crunchy livelihood opportunities. Now the crippling territory is forced to deal simultaneously with the so-called public debt and the reconstruction of the country.
Source:US Census 2017
In addition to the financial troubles , Puerto Rico has experienced a consistent loss in population, which has been exacerbated after the catastrophes and the unbearable living conditions for some. These two conditions when overlapped with other events in a timeline start to inform that the past eleven years Puerto Rico has been under socio economic distress while adjusting under an unbalanced realities like decrease in labor force and job opportunities, increase in the prices of products and services, contractions in social programs and accessibility for any special aid.
Yet, there are many socio-economic consequences related to the shrinkage of population and financial turmoil conditions nonetheless these are not equally distributed throughout the island given that Puerto Rico has seventy-eight municipalities (mapped below) suggesting that localized action has to be a core strategy and a closer look to these municipal boundaries is relevant.
What municipalities in Puerto Rico are at most risk in the event of another hurricane?
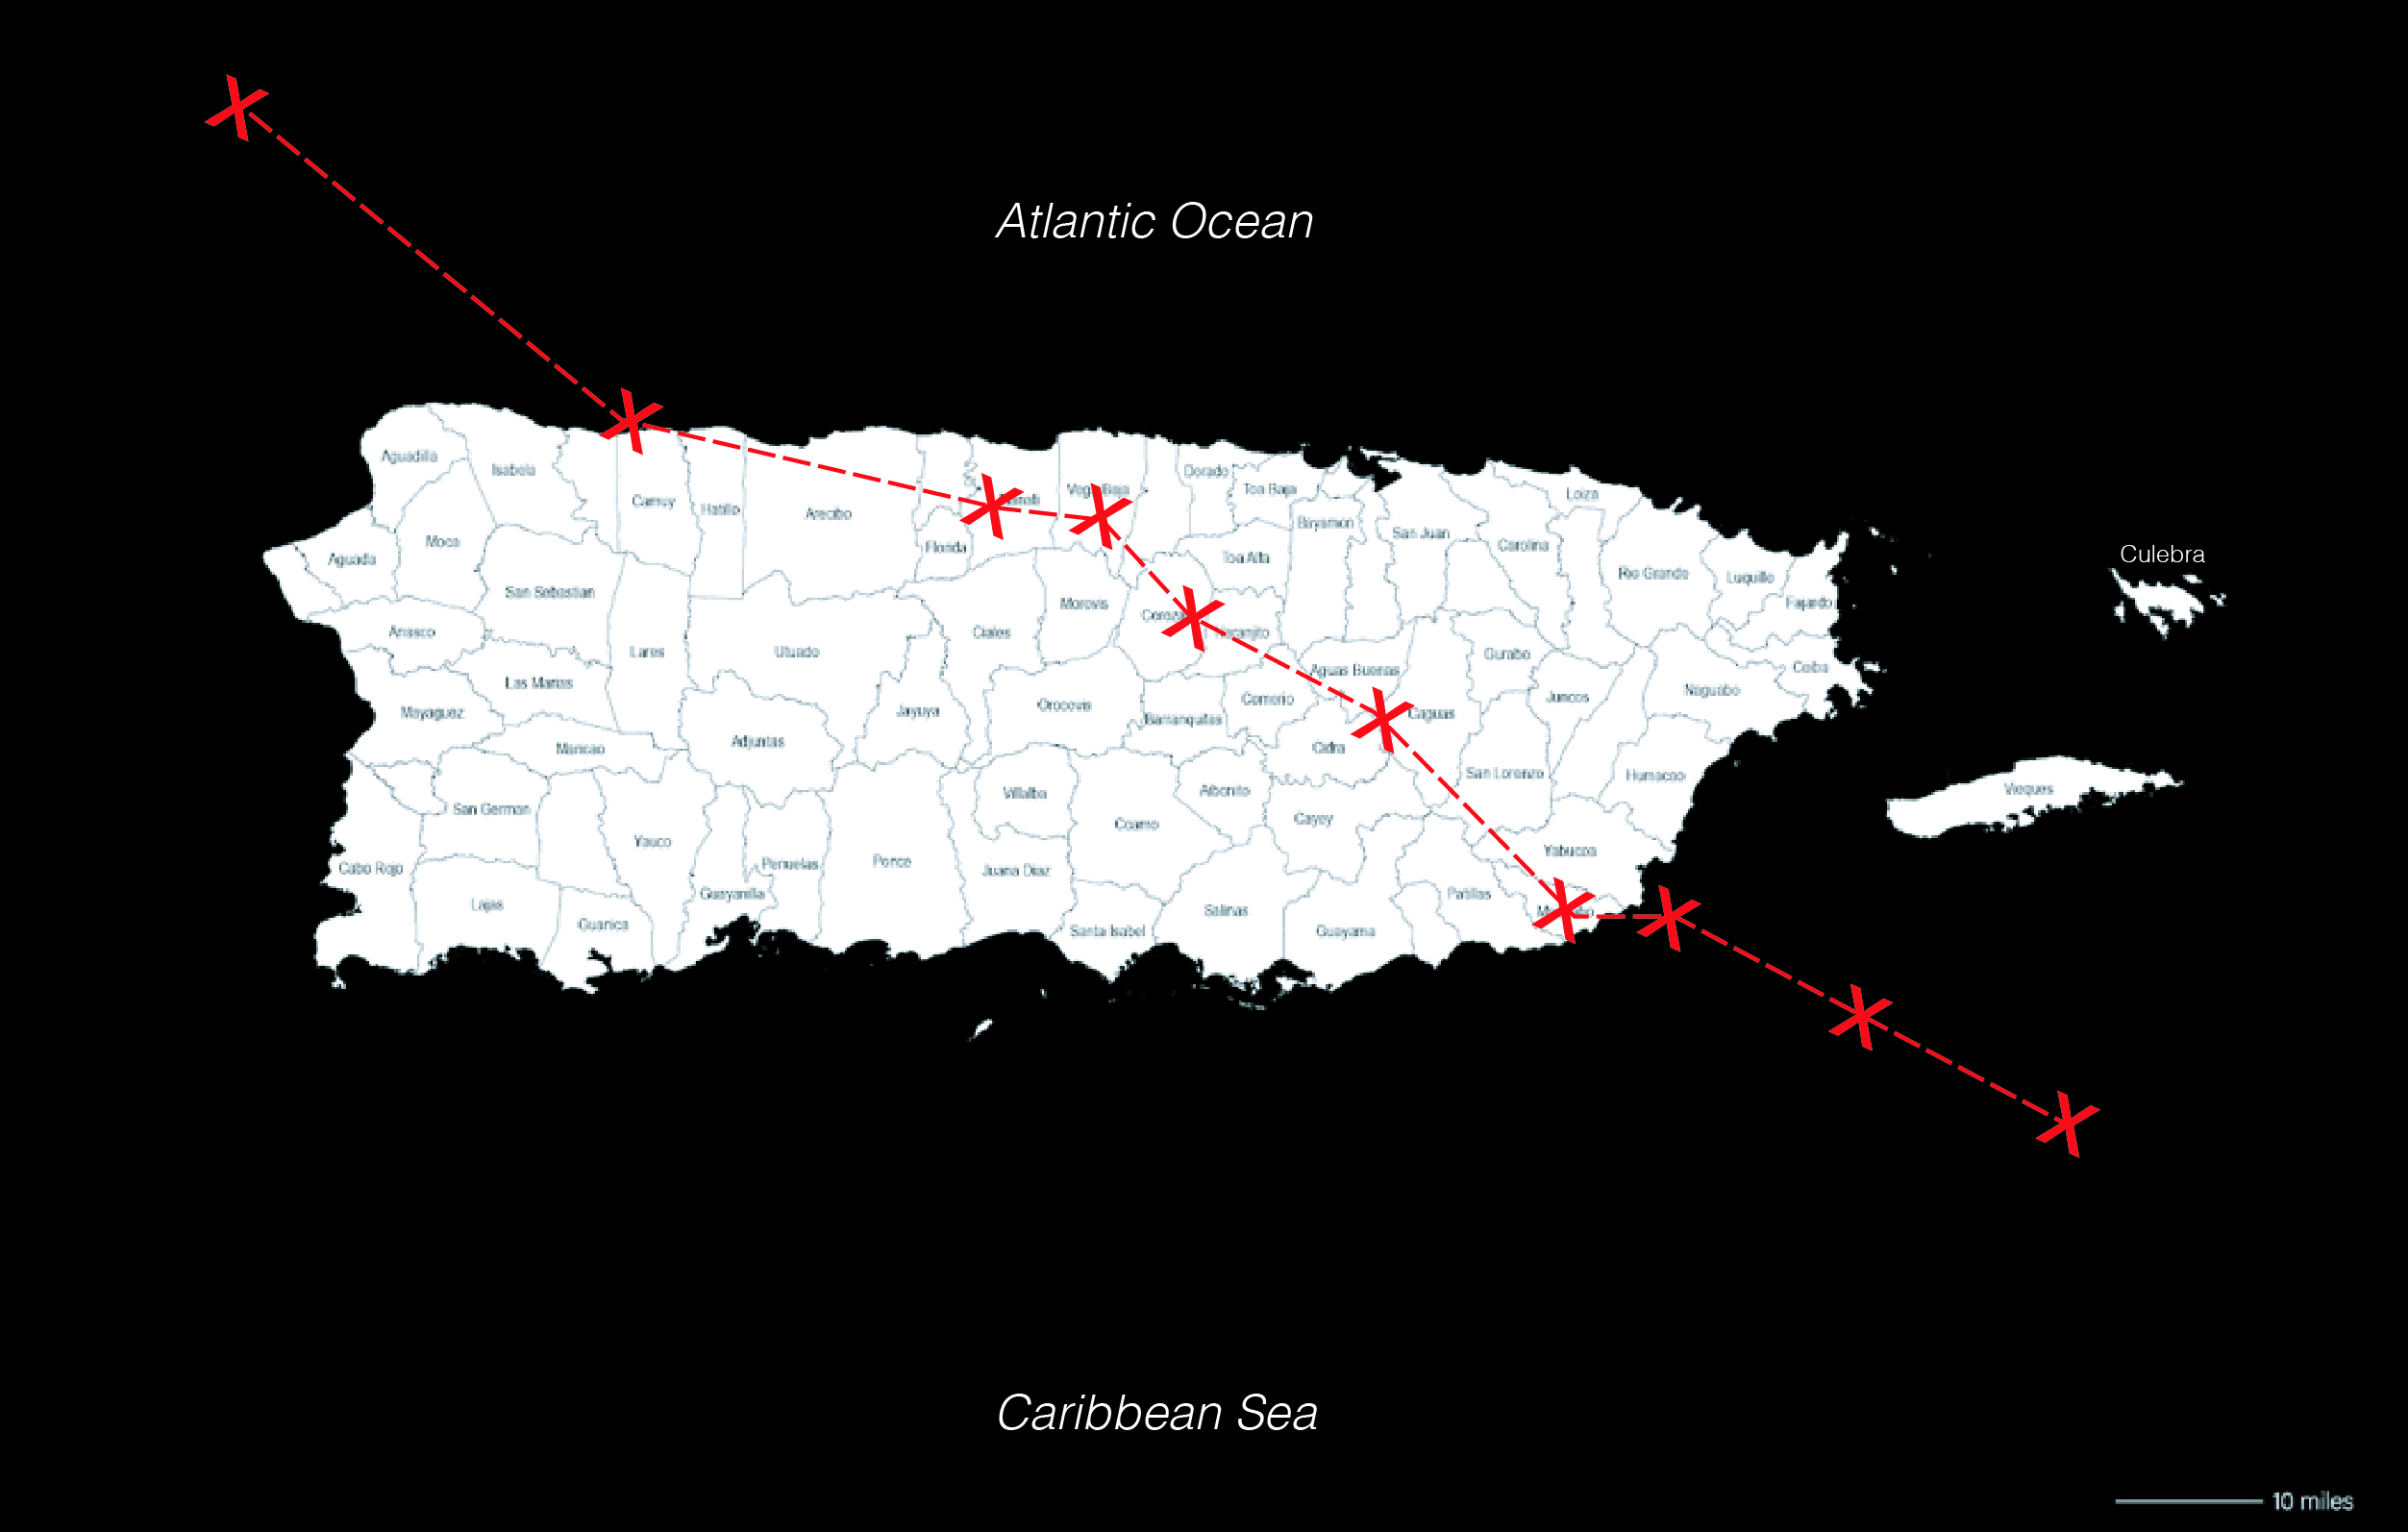 Source: Puerto Rico municipal map, 2018 by authors of the post. Red line is the path of Hurricane Maria’s eye, NOA.
For instance it is noticeable by re-plotting the path of the hurricane that fithteen municipalites have been directly struck by the “eye”of the hurricane. However, given the federal and island government’s inadequate response and the importance of municipalities in addressing local emergencies the project explores the physical and social vulnerability of all municipalities.
In order to have a better idea of the Island and to further understand the geography and its municipalities is important to highlight that the seventy-eight municipalities have various geographical conditions, from coastal to inland and from rural to urban areas in addition to having two separate municipal-islands Culebra and Vieques. Therefore using municipalities as a unit of study has constraints and difficult the creation of a baseline for comparing all municipalities at once since they vary not only in territory extension but also have diverse socio-economic conditions. However, acknowledging that municipalities are the second layer of governance (reflecting to an extent the central one) and at the same time are subjected to the “State” and Federal laws of the United States also marks a reason to study them. Furthermore, municipalities as localities, have become important arenas for decision-making, their role has had a pendulum effect during Puerto Rico’s planning and management of the urban fabric indicating their importance as a departing point to look at.
Mapping Municipalities at risk in Puerto Rico
“Disasters are sometimes considered external shocks, but disaster risk results from the complex interaction between development processes that generate conditions of exposure, vulnerability and hazard. Disaster risk is therefore considered as the combination of the severity and frequency of a hazard, the numbers of people and assets exposed to the hazard, and their vulnerability to damage.”(UNISDR, 2015a)
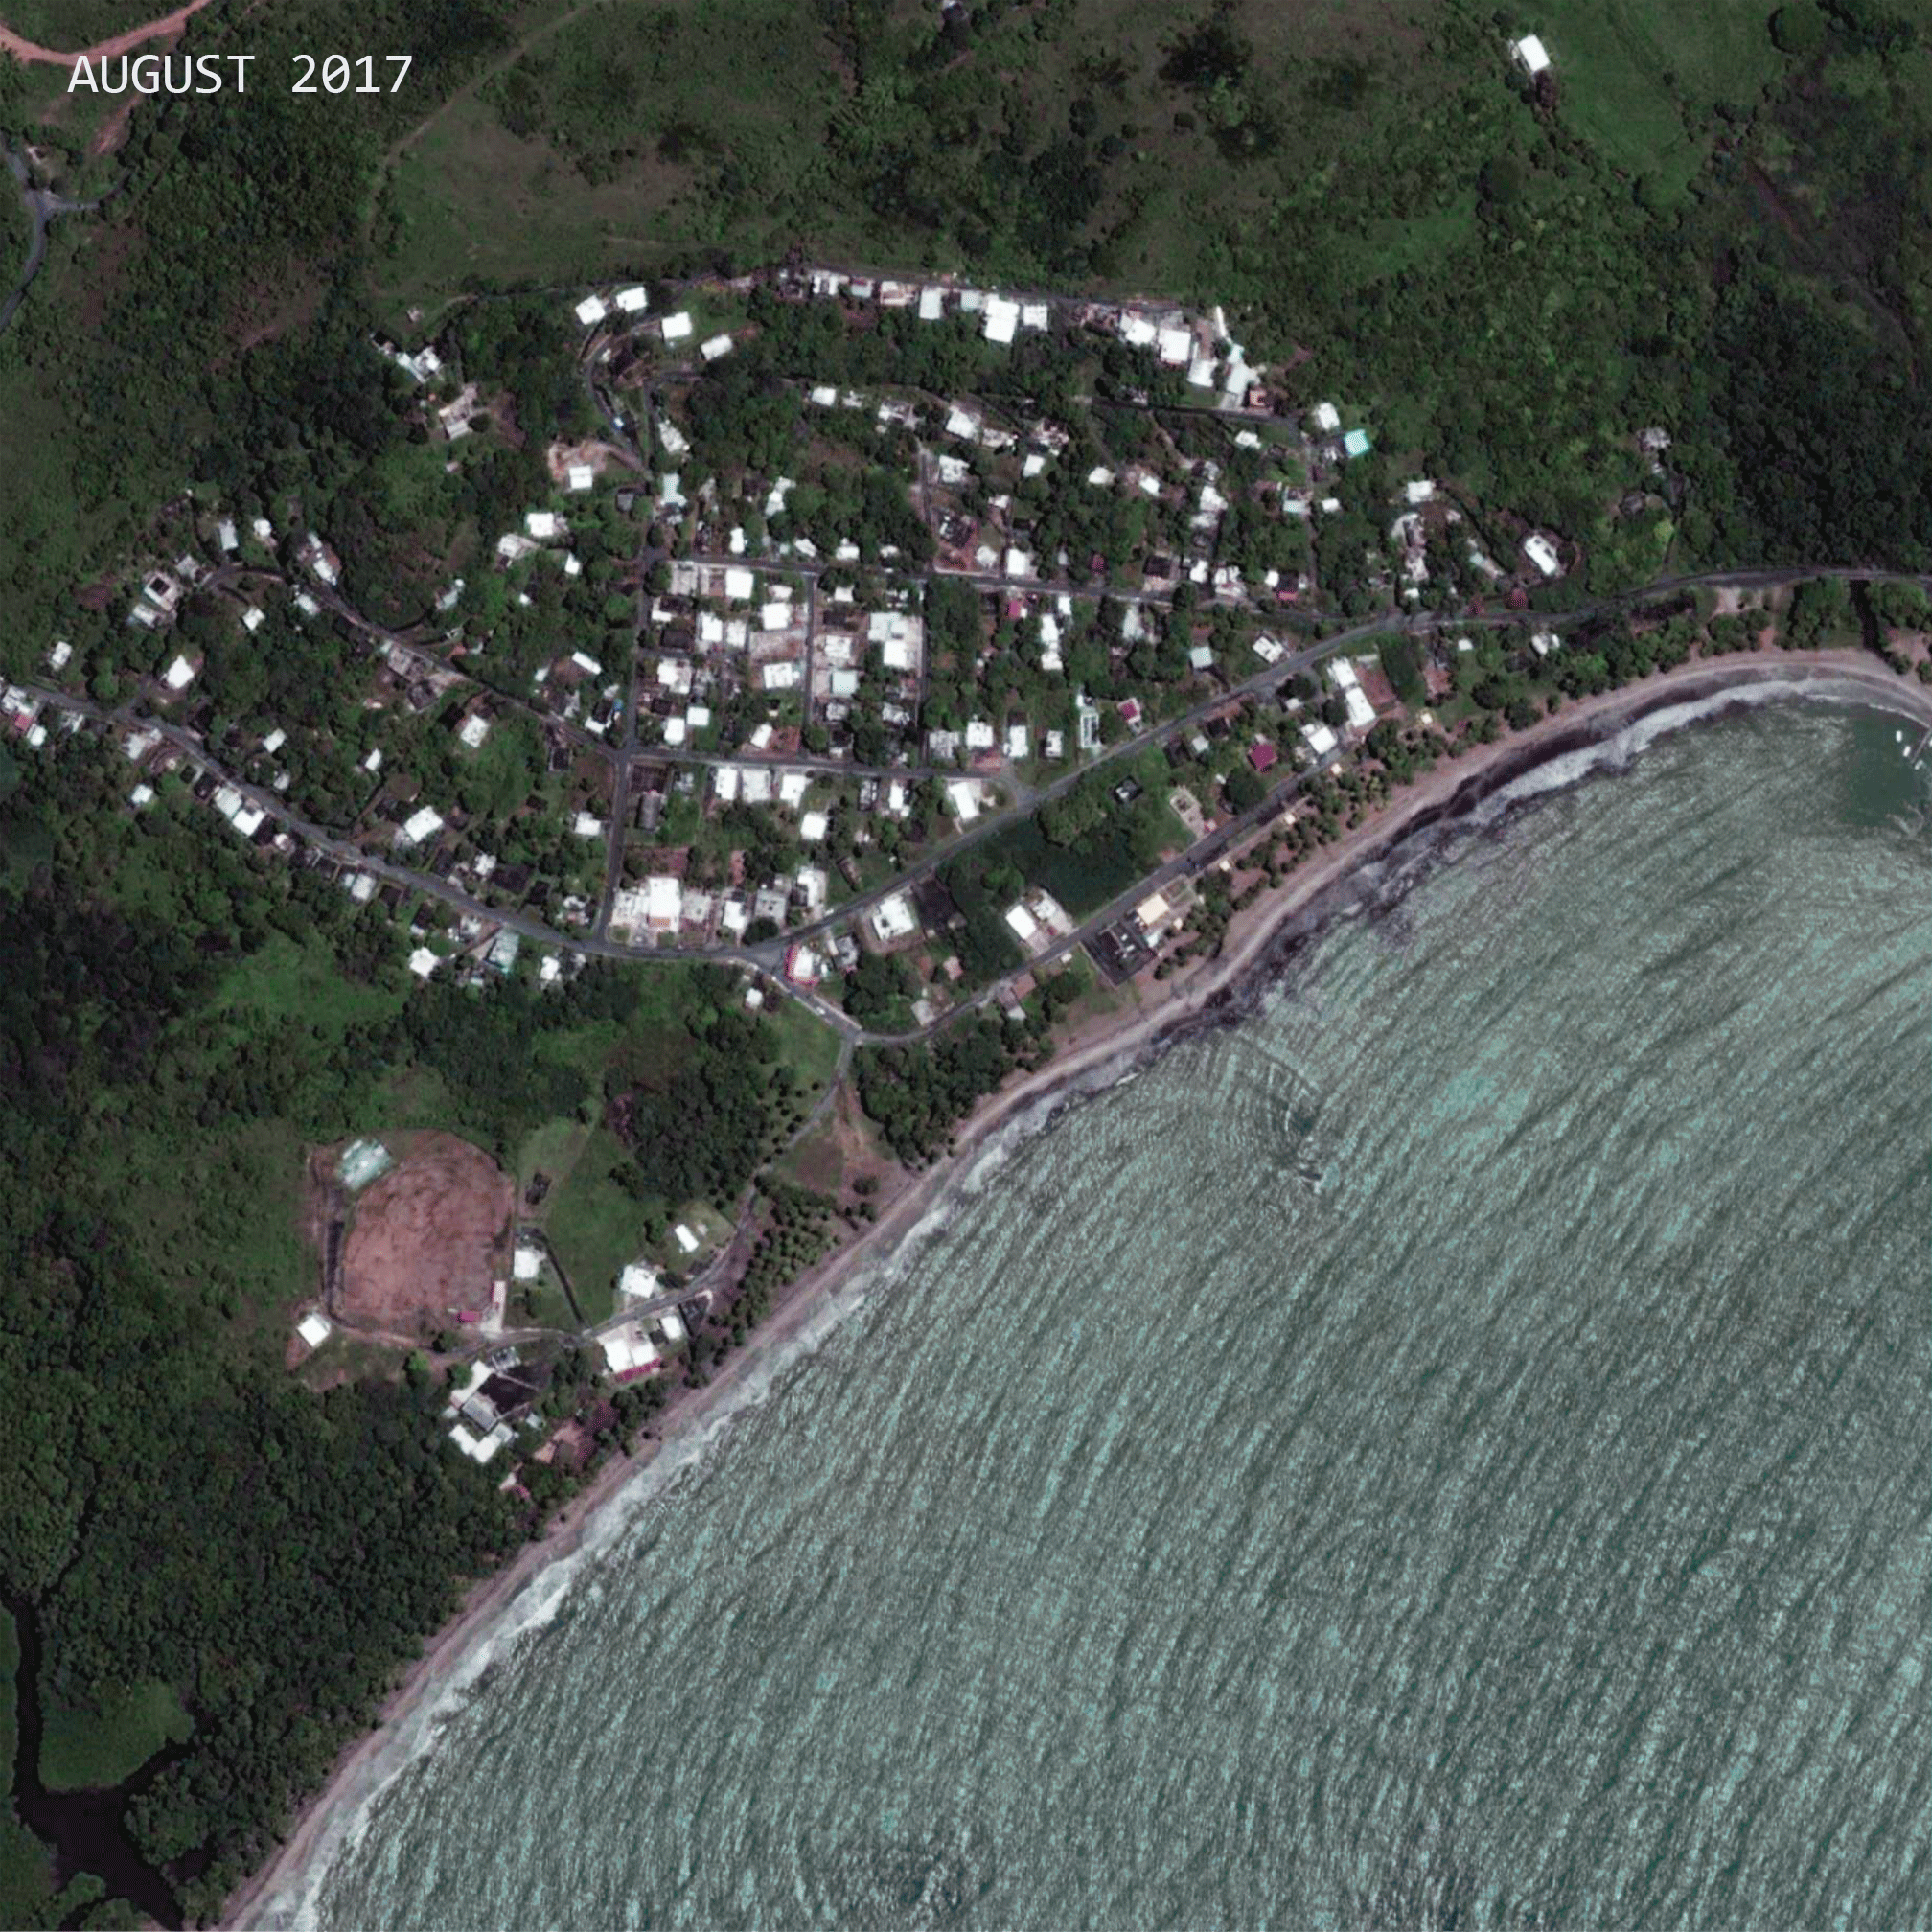
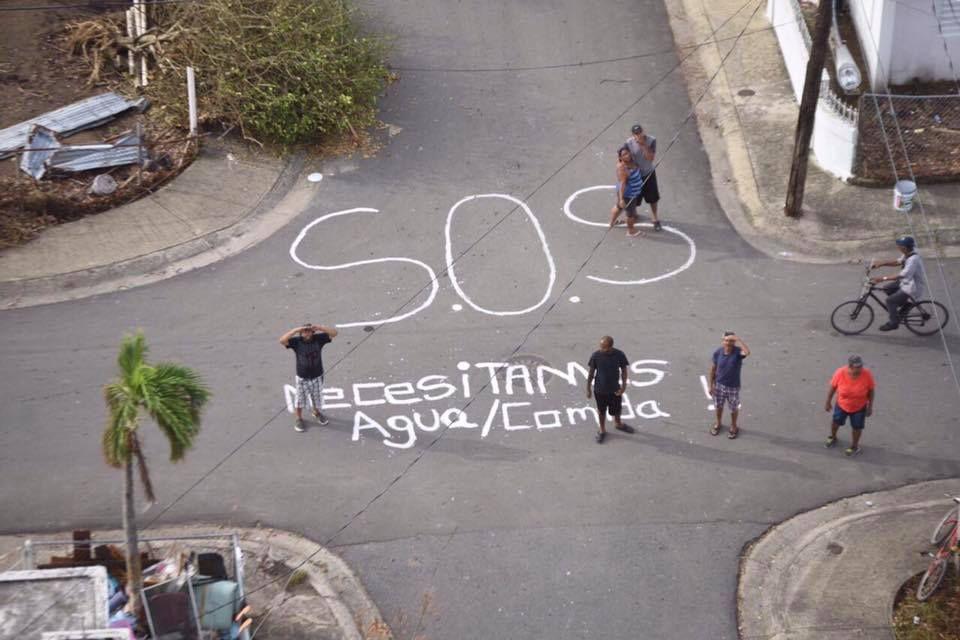 Source: Local pres - Humacao, Las María. 2017
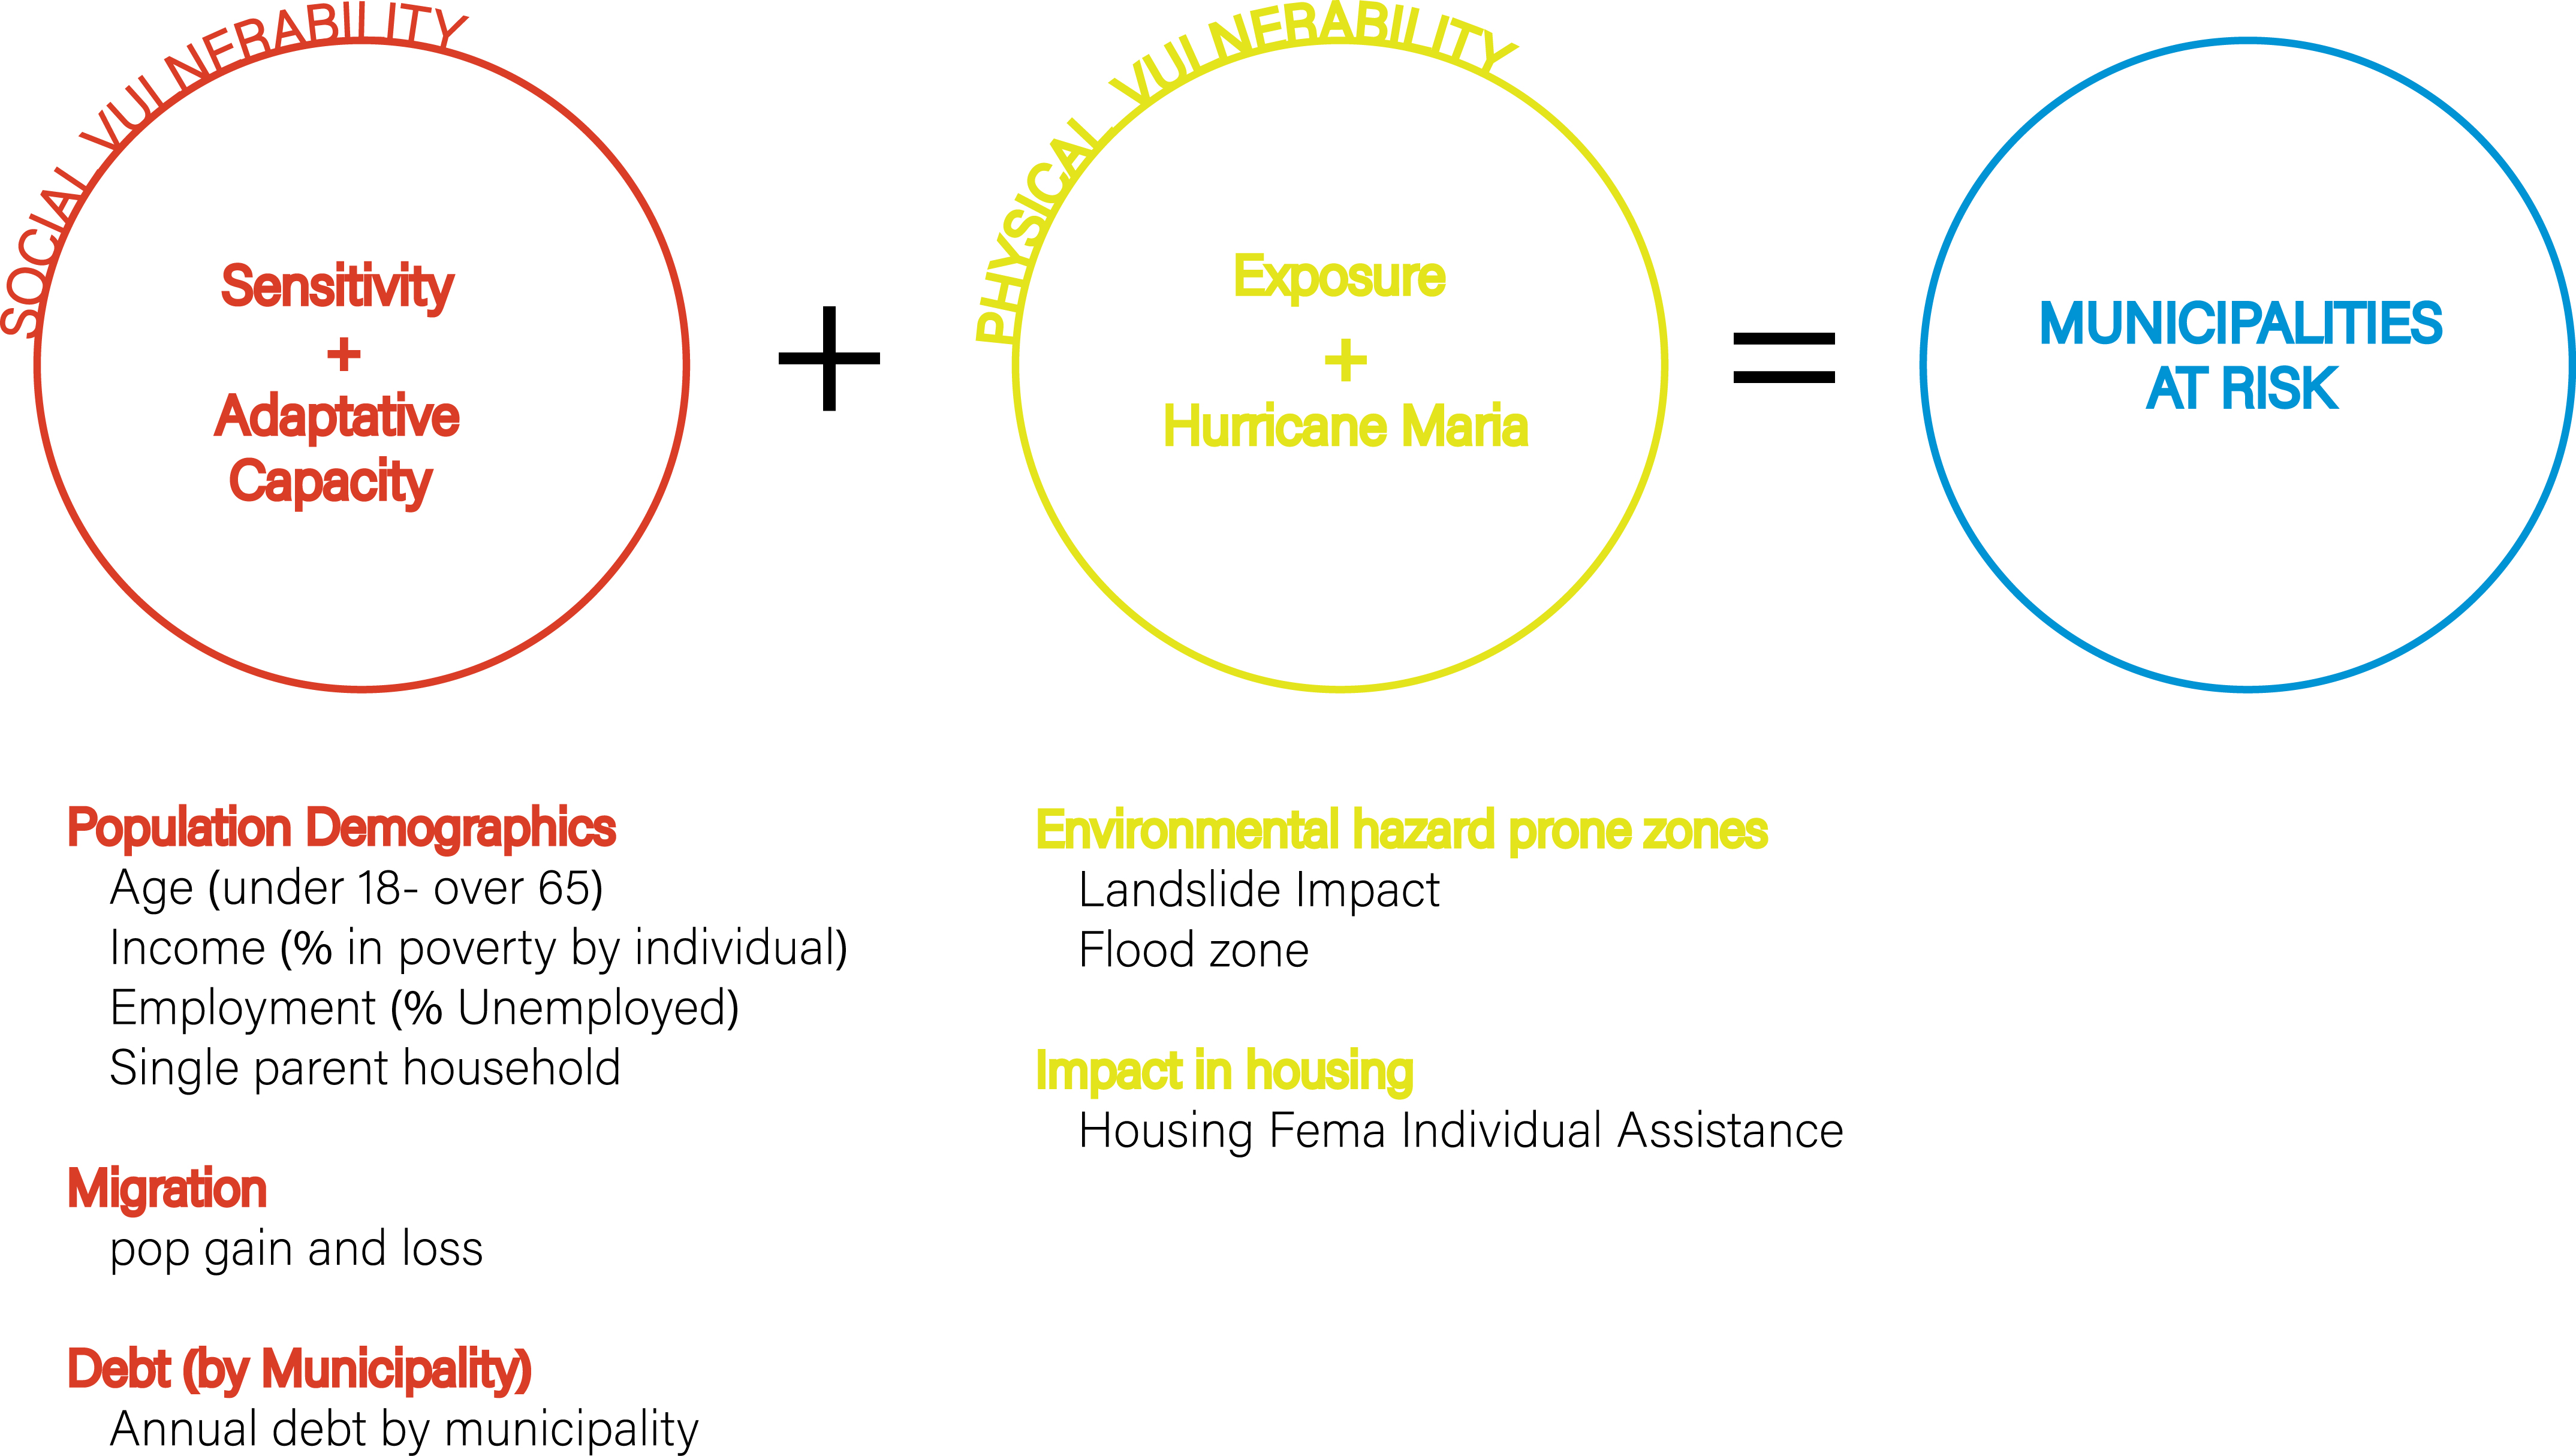
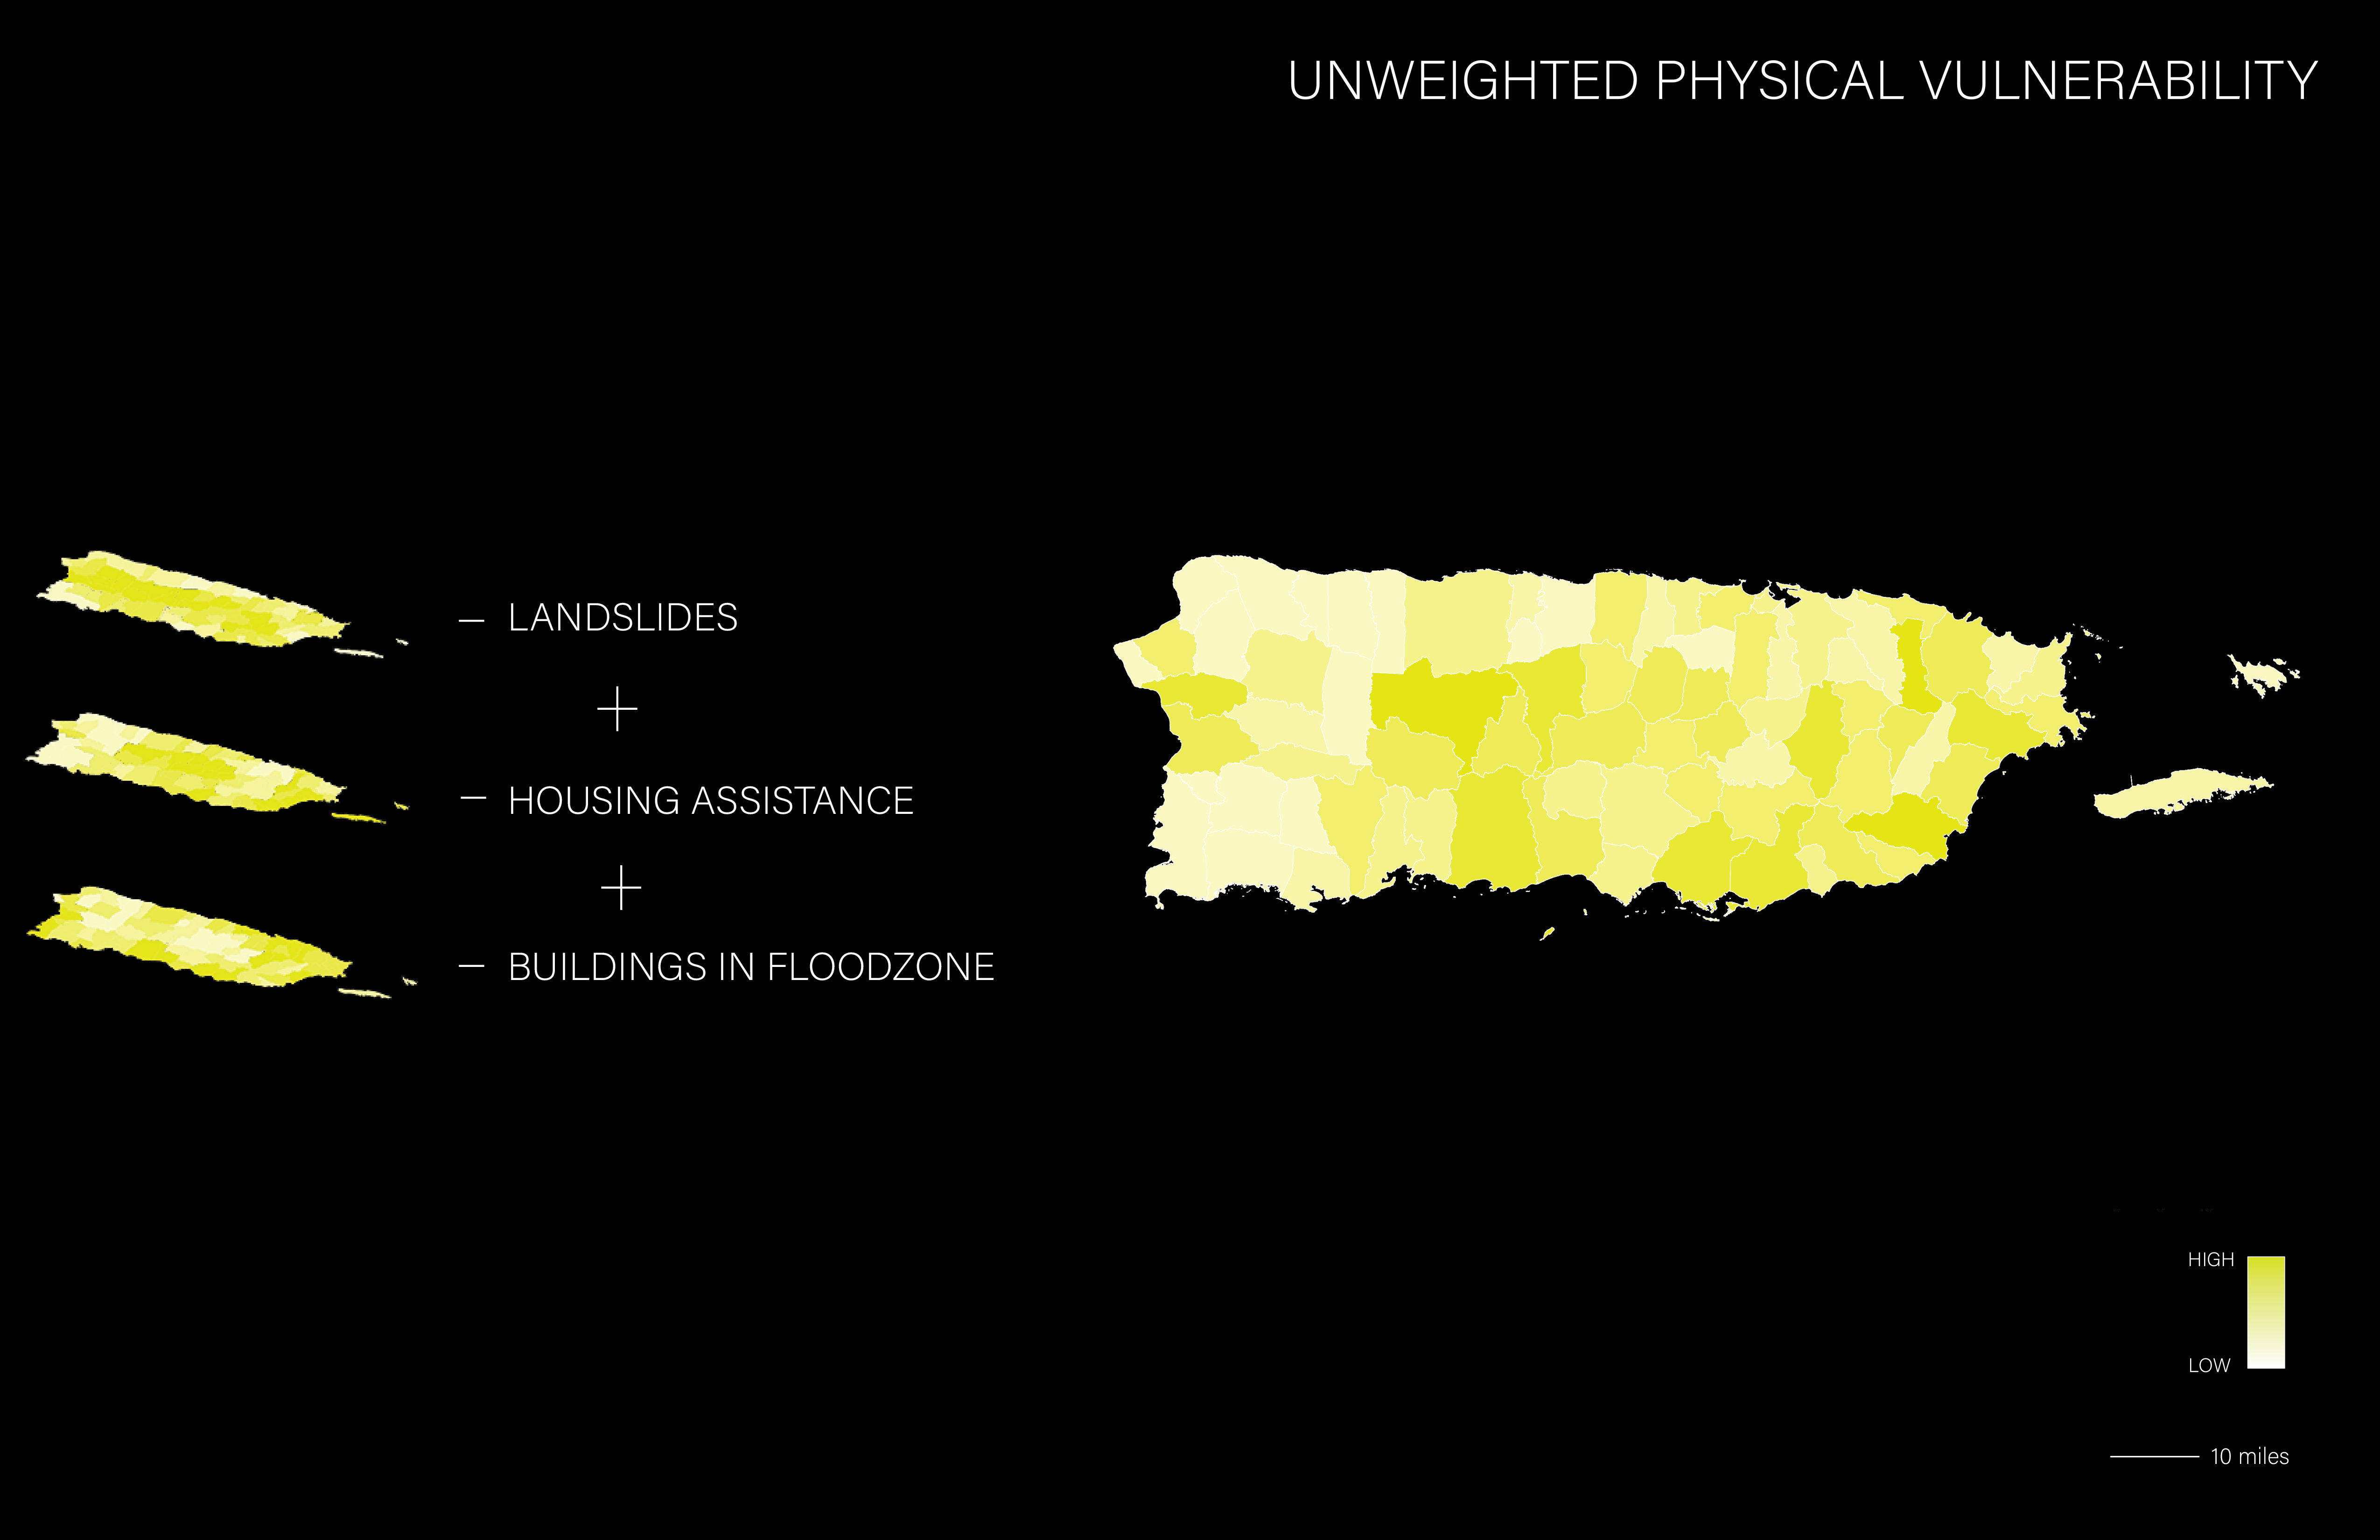
Due to the identified importance of municipalities to the ability of communities to survive disasters, the project cross-reference physical and social vulnerability highlighting Municipalities at most risk in the event of another hurricane. This project develops a decision model utilizing social and physical vulnerability metrics that are first mapped individually and afterwards added into one final model to render a digital map showing a higher risk for municipalities together with other possible impact in their capacity to recover in the event of another hurricane. By acknowledging the definition of disaster risk , which is expressed as the likelihood of loss of life, injury or destruction and damage from a disaster in a given period of time (UNISDR, 2015.) This project incorporates social vulnerability aspects including sensitivity and adaptive capacity of communities, along with physical vulnerability including exposure to hazards as landslides and flooding, and housing individual assistance related to the ongoing impact of Hurricane María. The following diagram illustrates the metrics considered in a decision model to determine municipalities at risk.
Mapping Social Vulnerability at a Municipal level
 Data Source: Banco de Municipio, 2017 and US Census 2017.
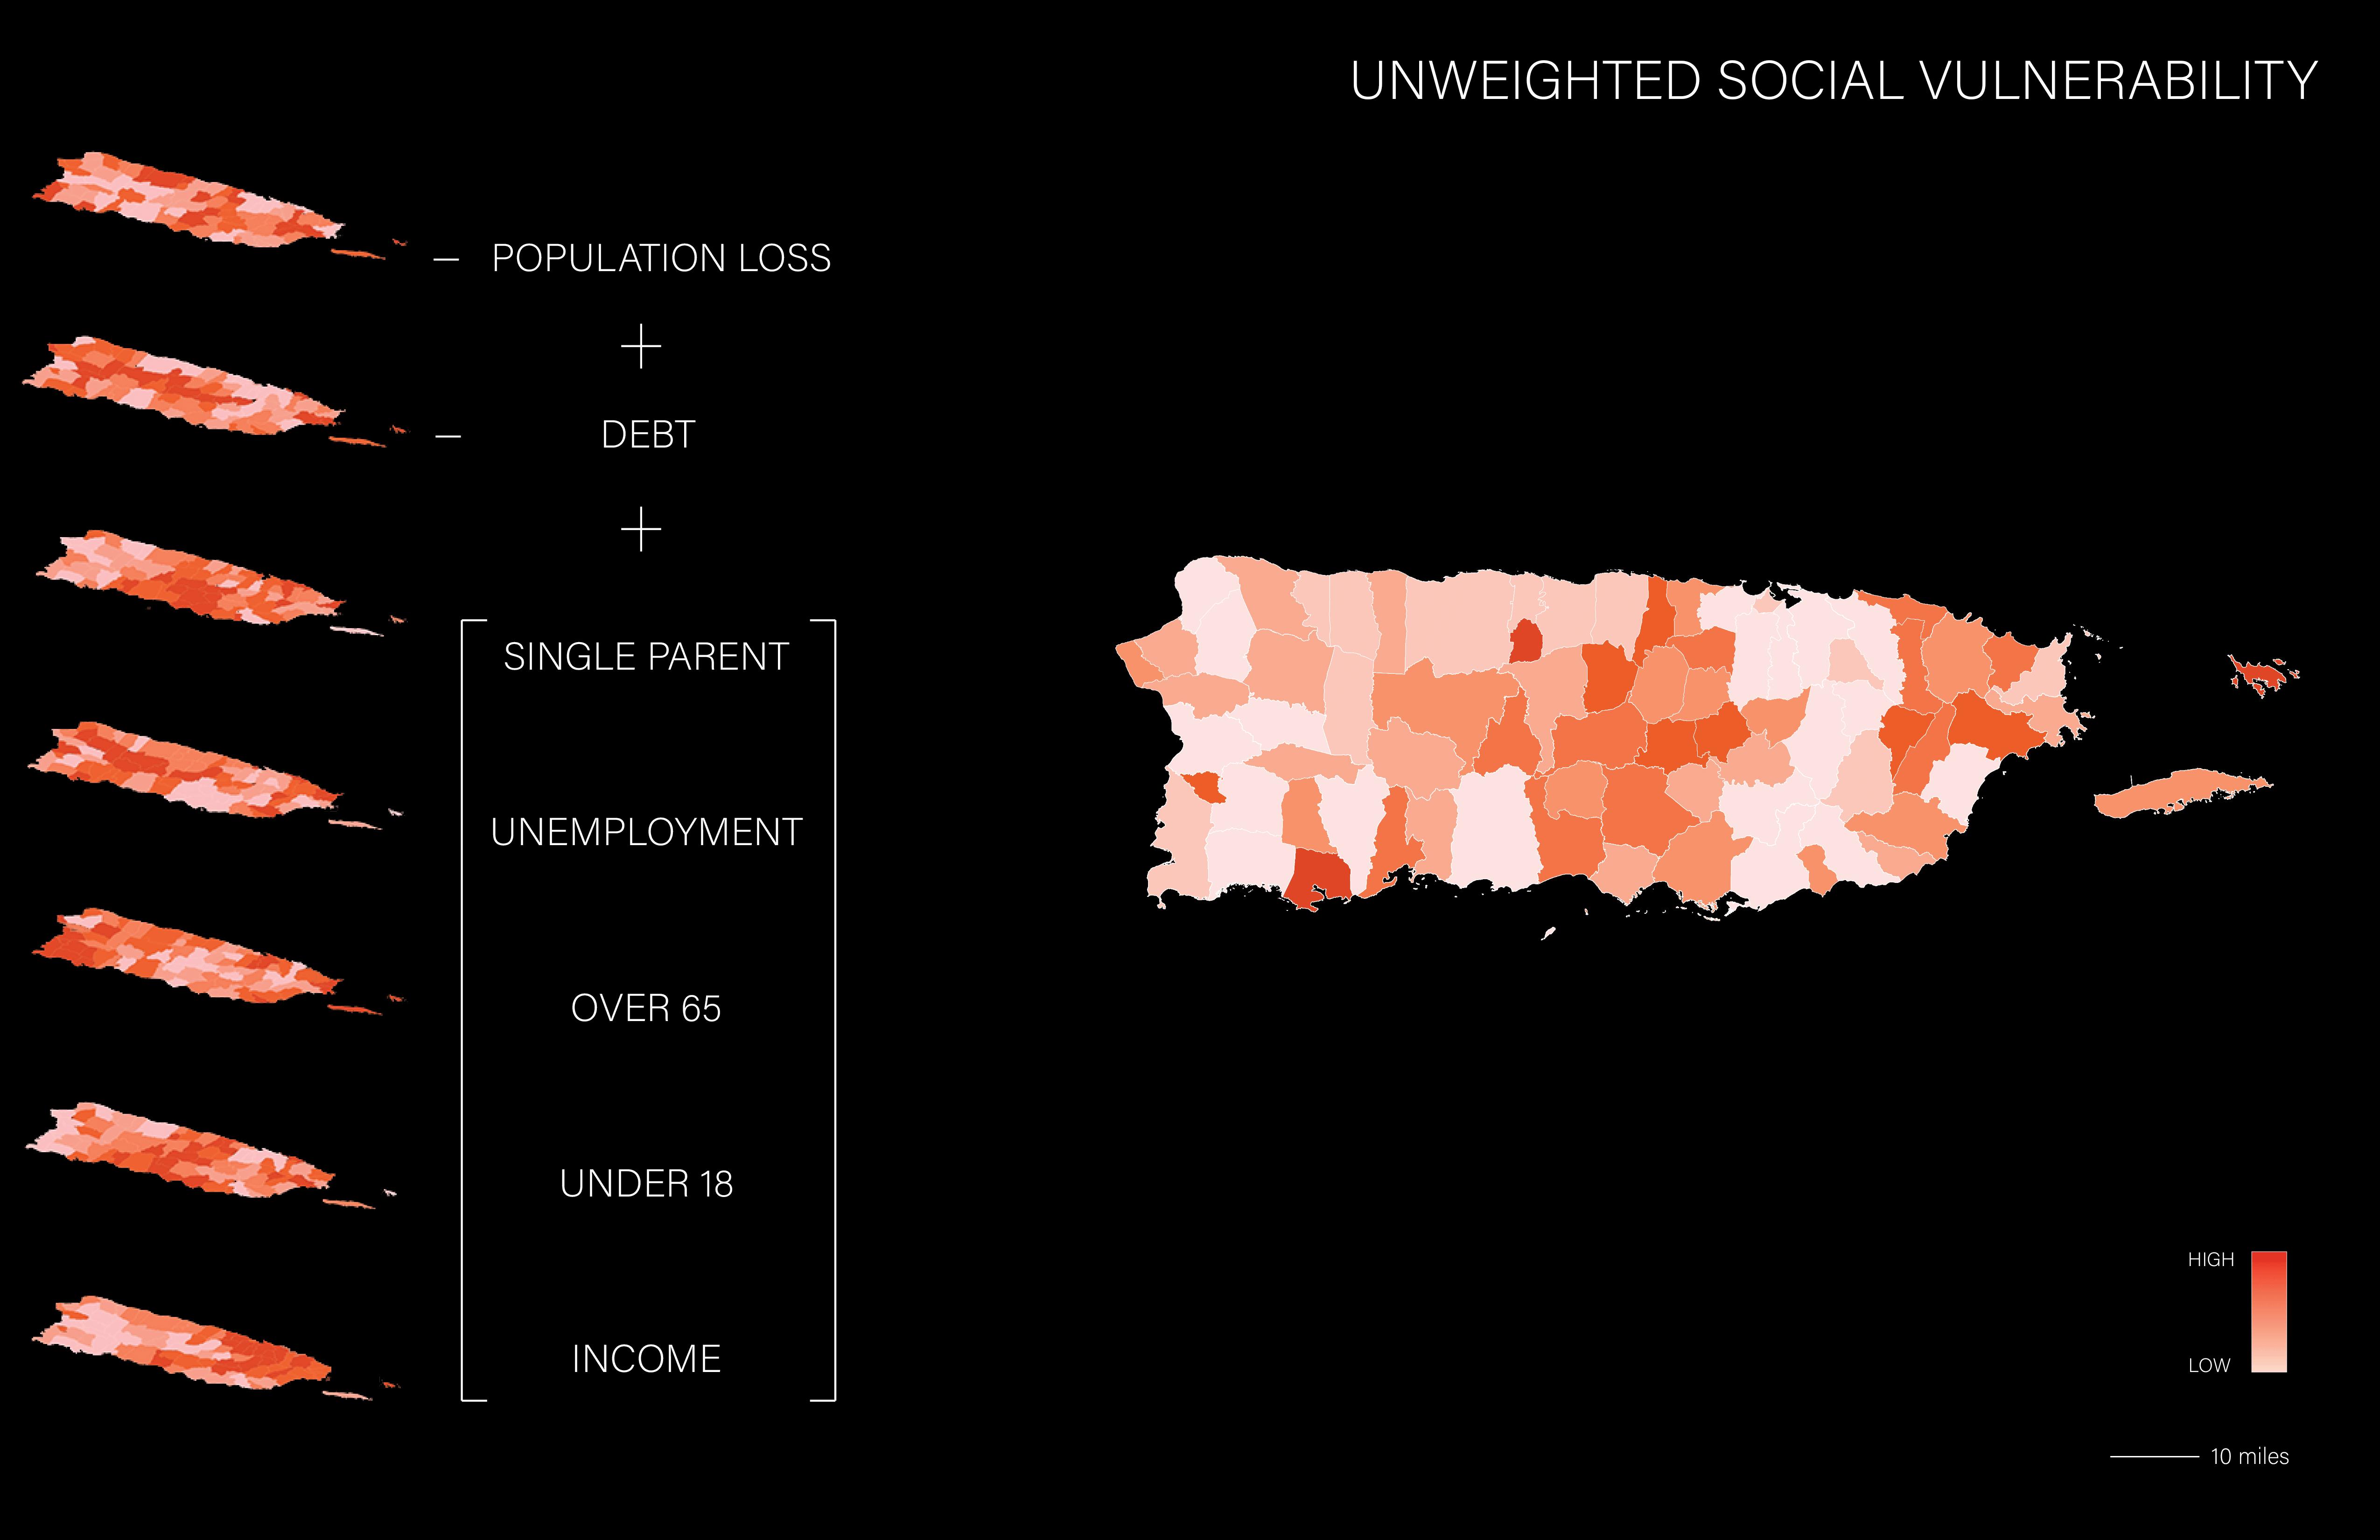
The social vulnerability indicators are based on demographics and socioeconomic factors, including the change in population between 2013 and 2017. The metrics included have been recognized as relevant to determine social vulnerability in Puerto Rico. However, this model could be more extensive and include more specific indicators.The maps showed represent unweighted scores, meaning that population loss, debt and demographic metrics are equally weighted. While at the same time three maps are presented prioritizing each of the metrics illustrating multiple combinations of vulnerability therefore a way to understand multiple lenses of risk.
Mapping Physical Vulnerability at a Municipal level
 Data Source: FEMA 2017
The Physical vulnerability considers environmental conditions and registered impacts on the housing stock retrieved by using FEMA’s Individual assistance information and existing datasets from the build environment. The analysis considers “municipios” as a primary unit given the recopilated information is quantified at this level of governance. An existent social vulnerability index (SVI) for Puerto Rico developed in 2017 was revised, but as it is based on census tracts is not transferable to our study. This difference between census tracts and municipios is relevant because municipios are in charge until this moment of implementing and coordinating local acton plans also marking the as key players in the provision of services and resilience efforts for the communities.
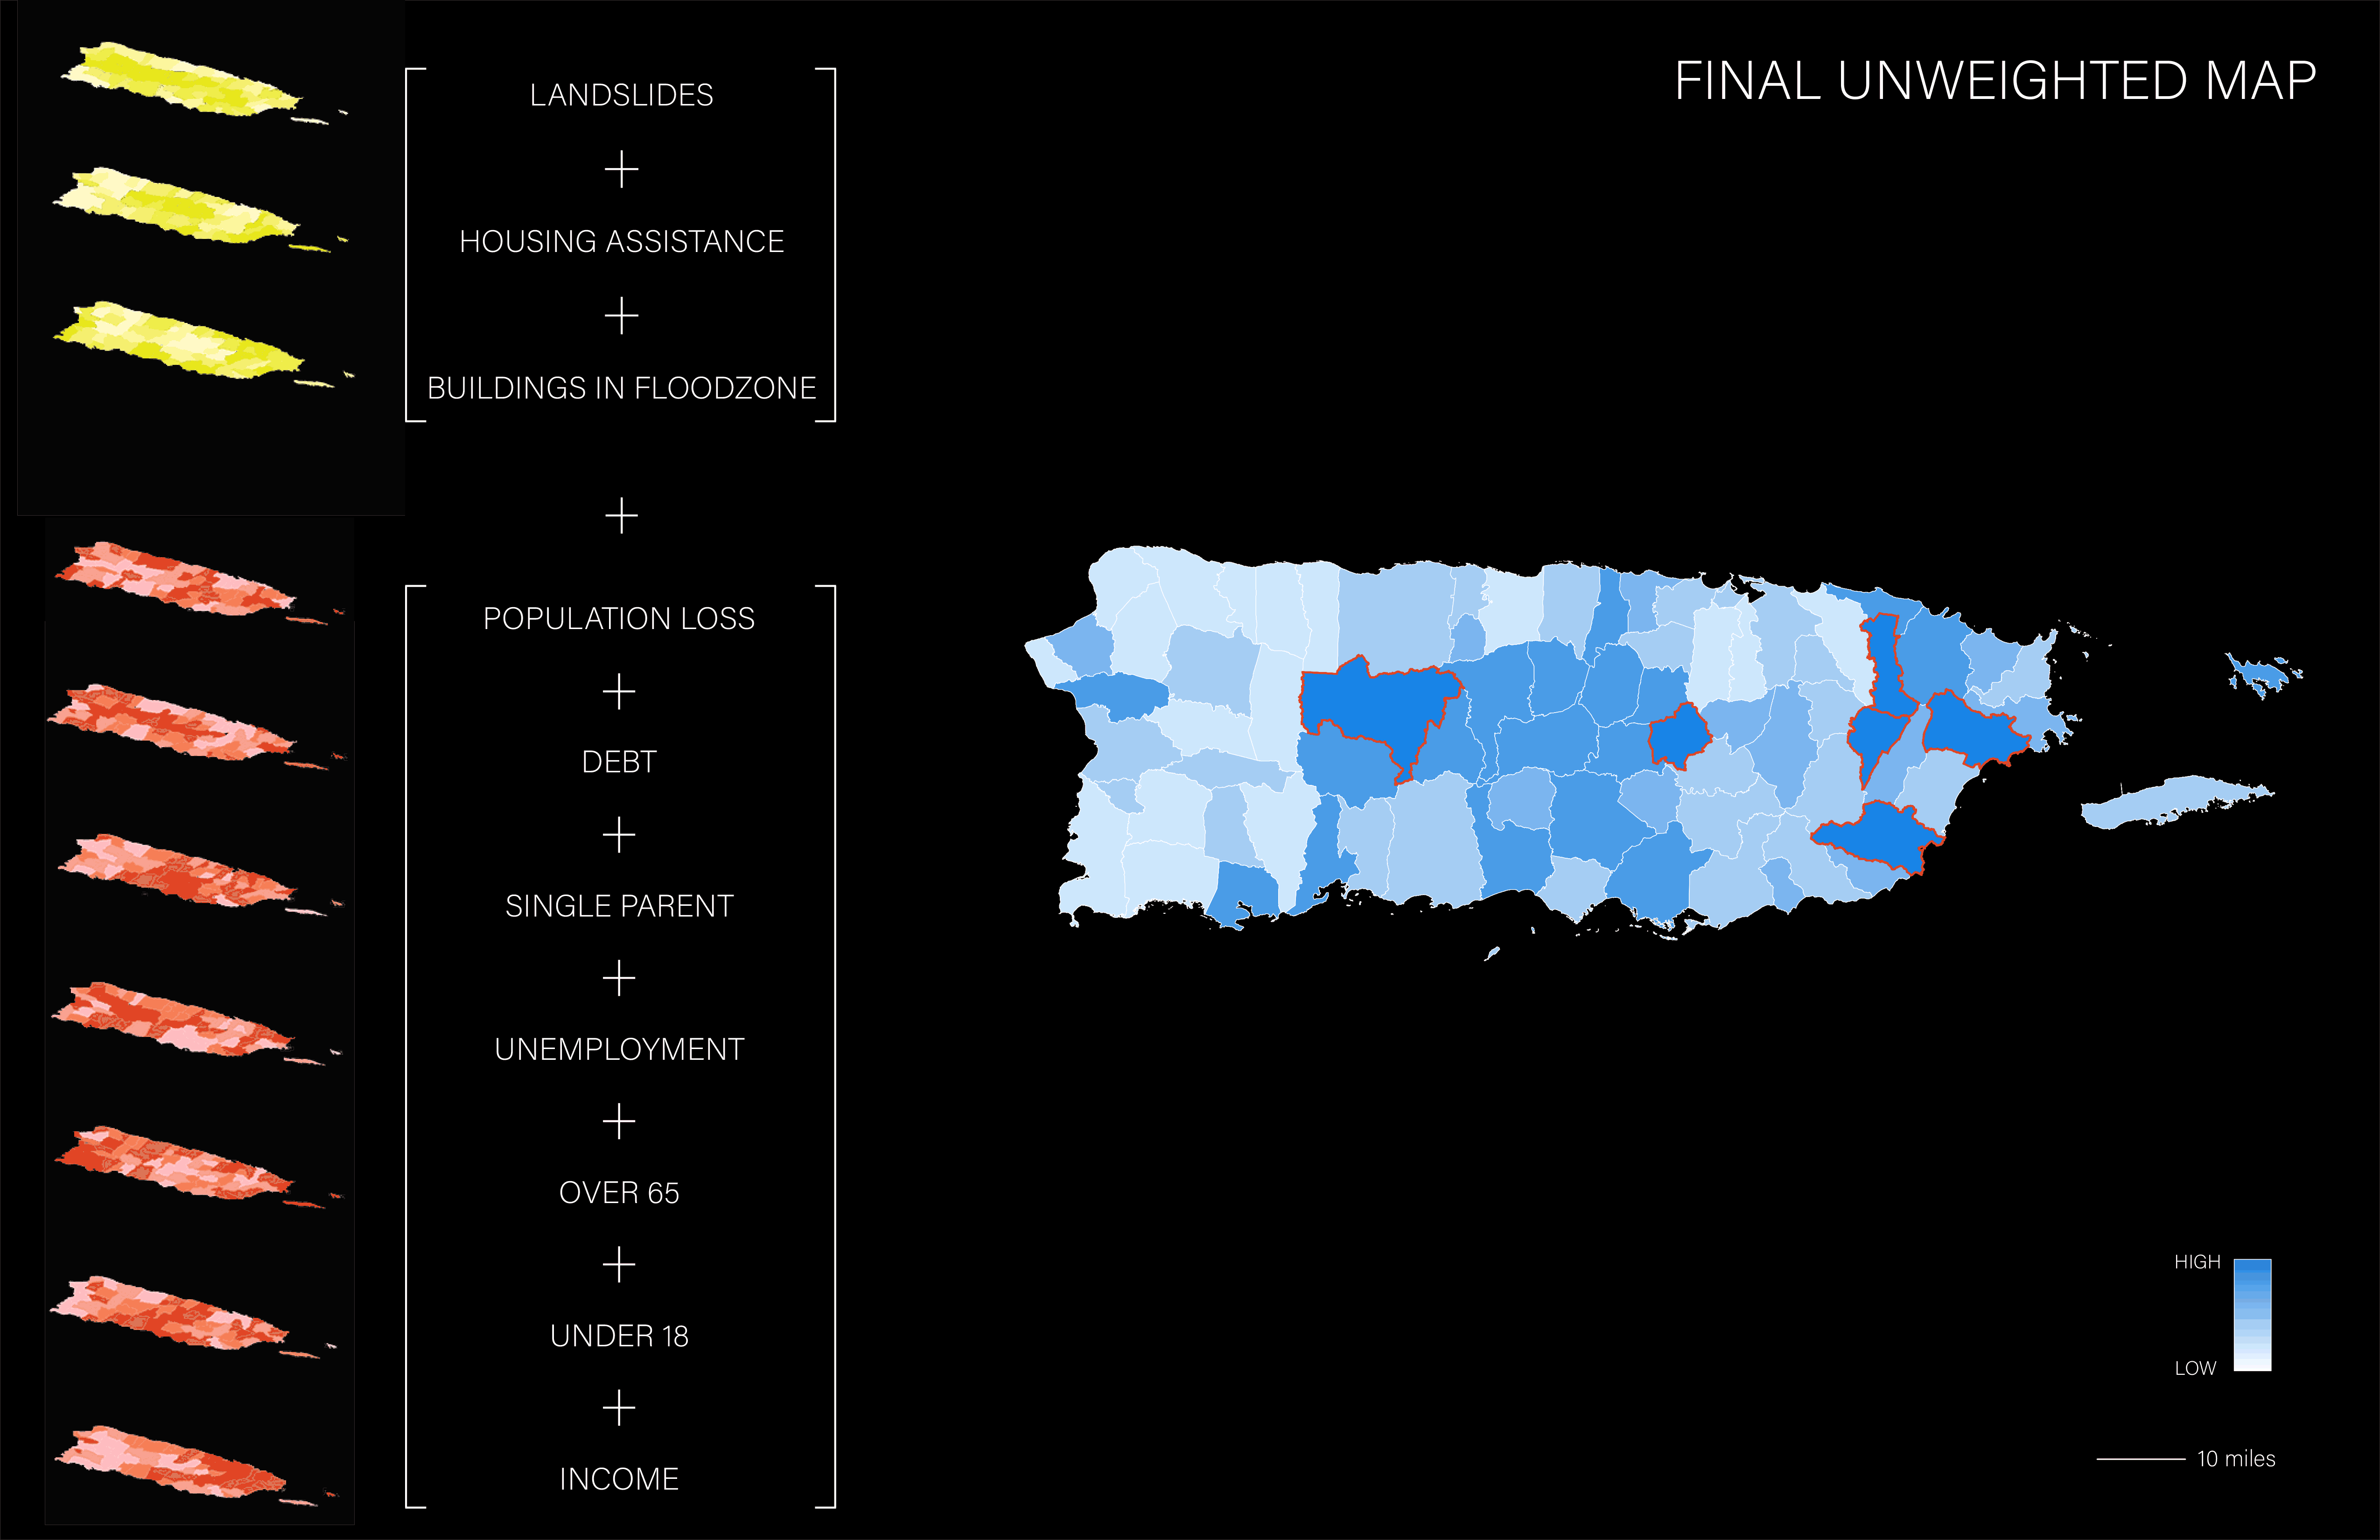
Building a Decision Model: Social Vulnerability + Physical Vulnerability
 Data Source: Data Source: Banco de Municipio, 2017, US Census 2017, FEMA 2017.
After identifying and mapping physical and social vulnerability indicators that further inform the current status of municipalities in Puerto Rico, the project performs a decision model that combines these two approaches by visualizing municipalities that are at most risk and vulnerable in the case of another climate event. The decision model shows three alternatives to identify municipalities at risk, first prioritizing social vulnerability, second prioritizing physical vulnerability and finally an unweighted map in which both physical and social indicators have the same weight.
Identifying municipalities that are at most risk in the event of another climate event
 Decision Model Results
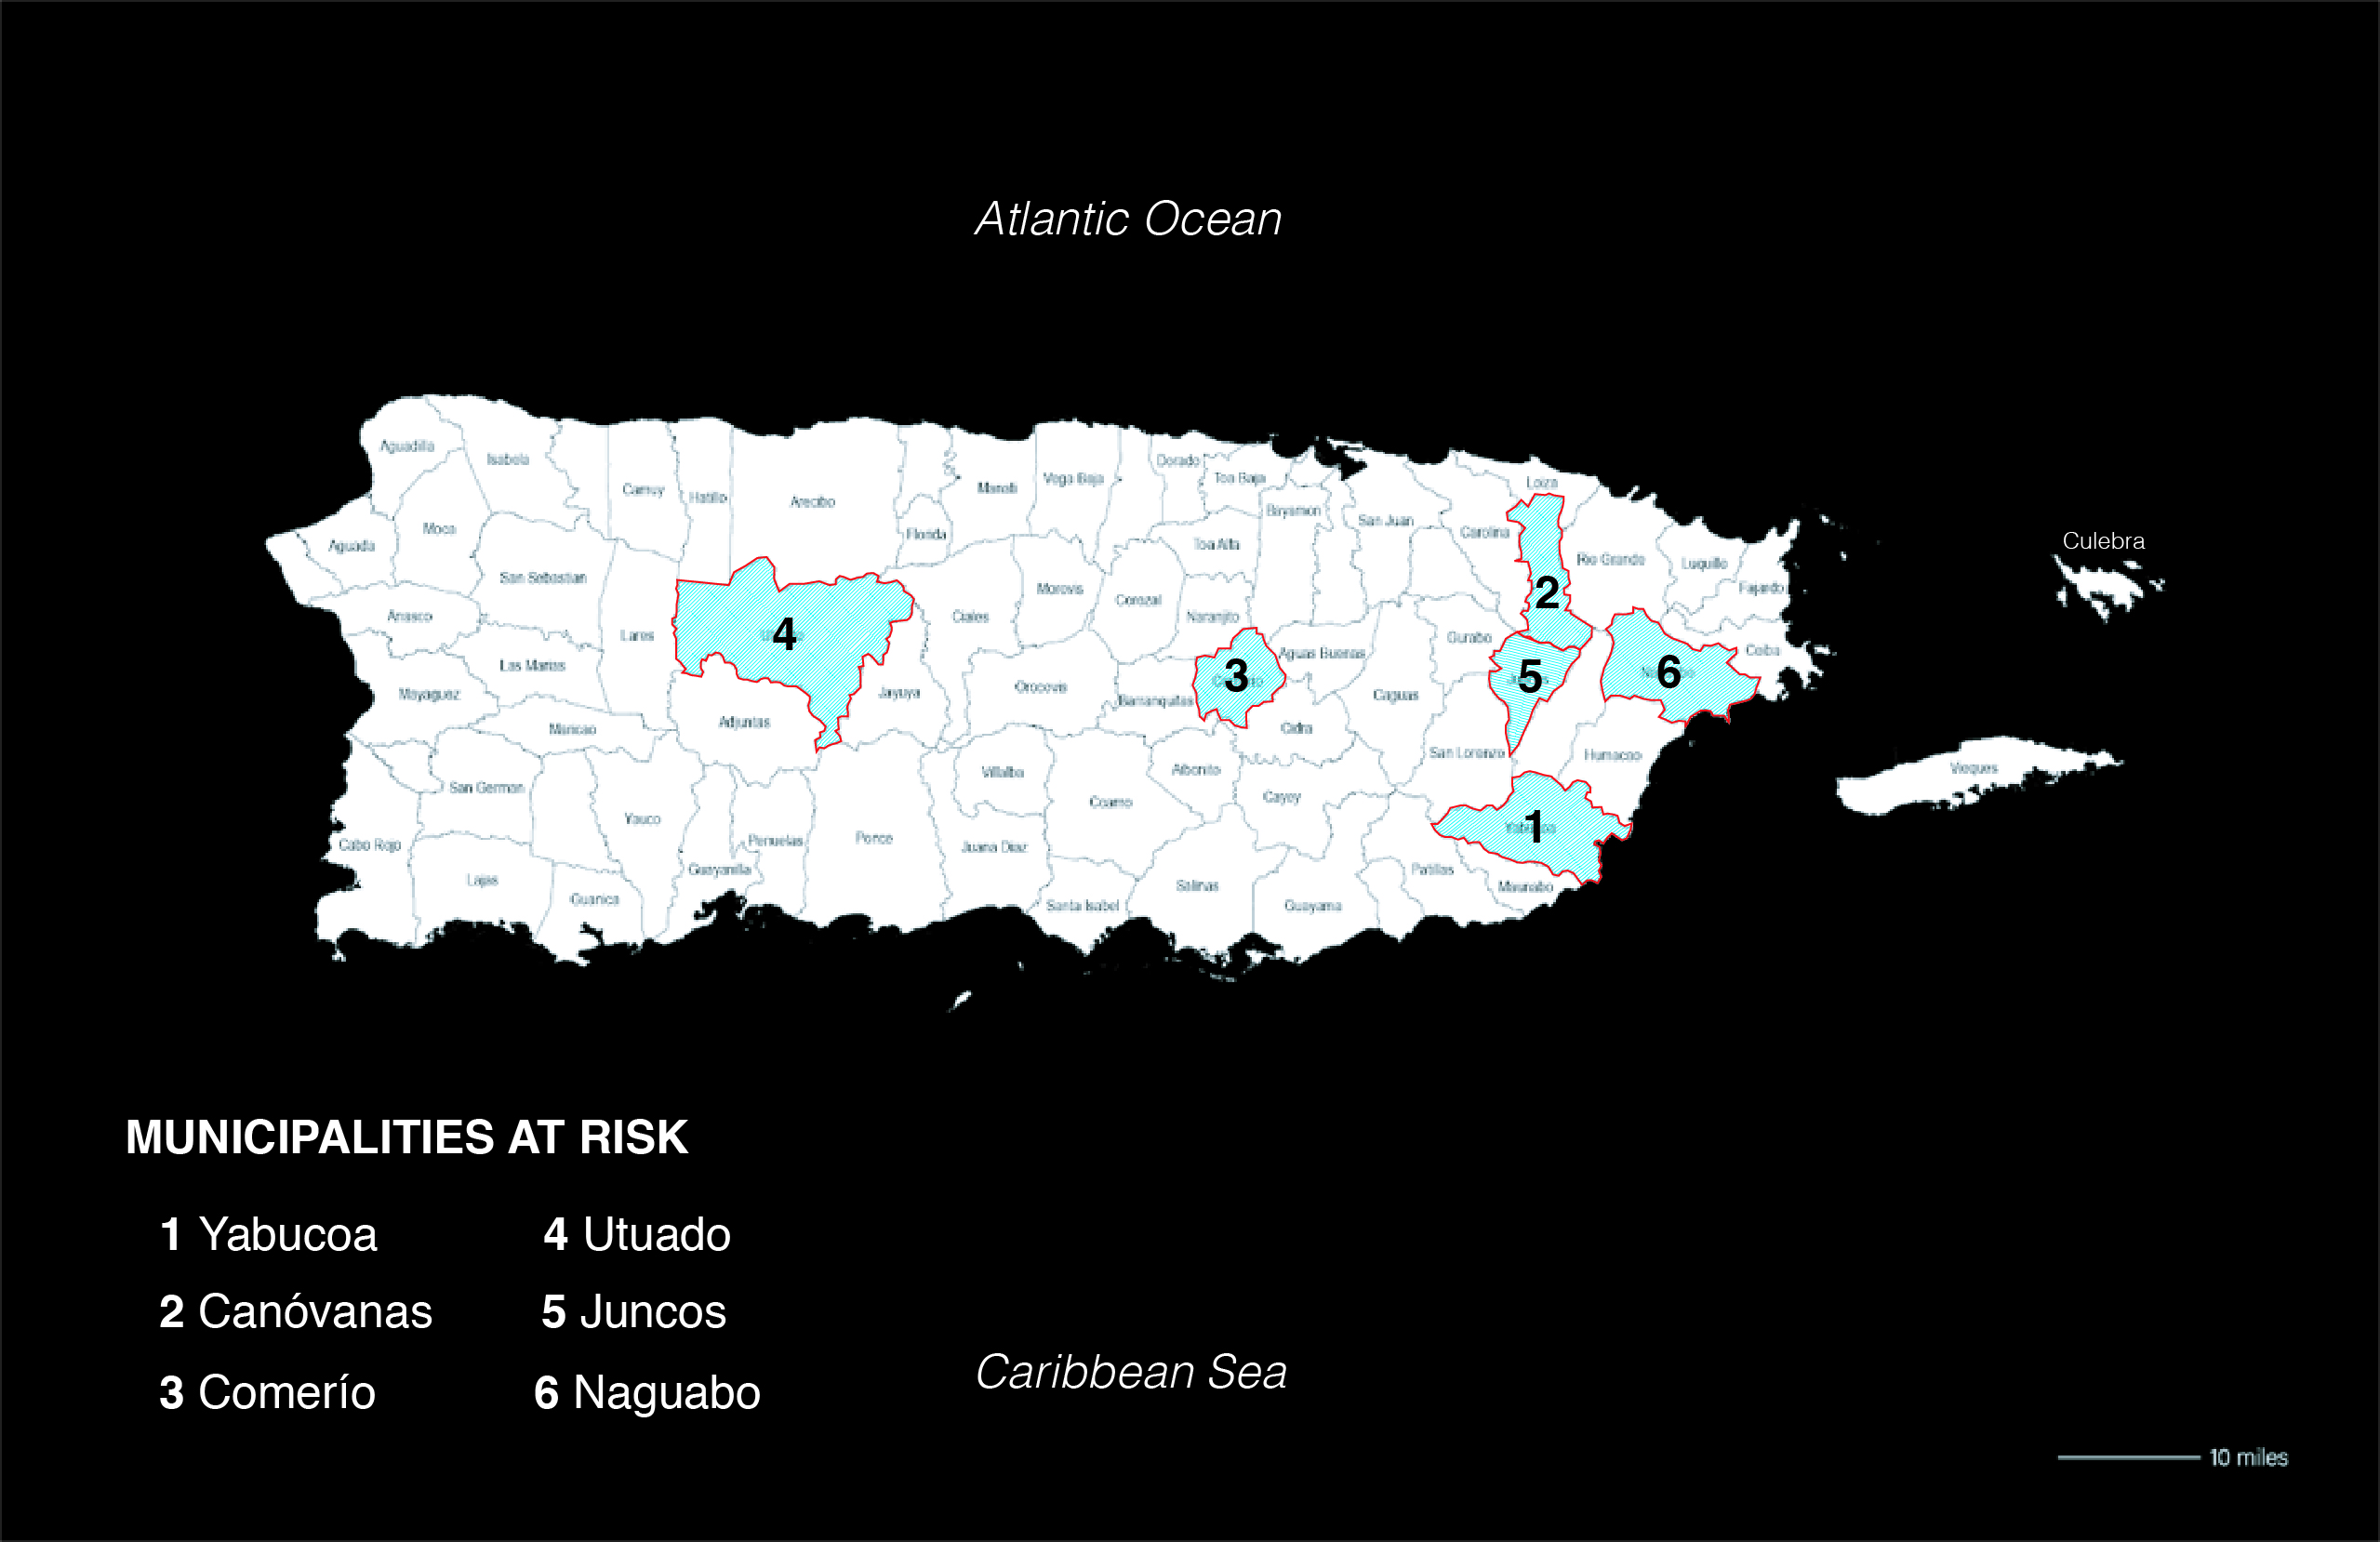
The results of the analysis of Social and Physical vulnerability at a municipal level throughout a combined layer decision model marks that the municipalities of Yabucoa, Canóvanas, Comerío, Utuado, Juncos, and Naguabo are consistently ranking high scores. The scores suggest that significant conditions of vulnerability are in place signaling their risk to be able to recover at the moment and in future climate events. These identified municipalities could serve as case studies for further research and a starting point for any program or effort that offers extra aid or support that will come in the future. By identifying these five municipalities it can be argued that all the geographic conditions found in Puerto Rico are at stake since these five municipalities are from either the inner central mountainous region, coastal part or at the urban denser peripheries.
In general Hurricane Maria revealed that the mitigation plans against hazards in Puerto Rico are not uniform, which makes it difficult for some of the municipalities to request and receive funds to finance the projects that could place them in a better position in regard of managing future emergencies. The mitigation plan is a document generated by the municipal government of Puerto Rico. Out of the five municipalities three (Utuado, Yabucoa and Comerío) have already been chosen by Puerto Rico’s Planning Board to provide support in reviewing and updating their mitigation plans (Alvarado,2019).
The results of the analysis of Social and Physical vulnerability at a municipal level throughout a combined layer decision model marks that the municipalities of Yabucoa, Canóvanas, Comerío, Utuado, Juncos, and Naguabo are consistently high scored. These findings suggest that significant condition of risk are in place which requires immediate attention.
Snapshots to Municipalities
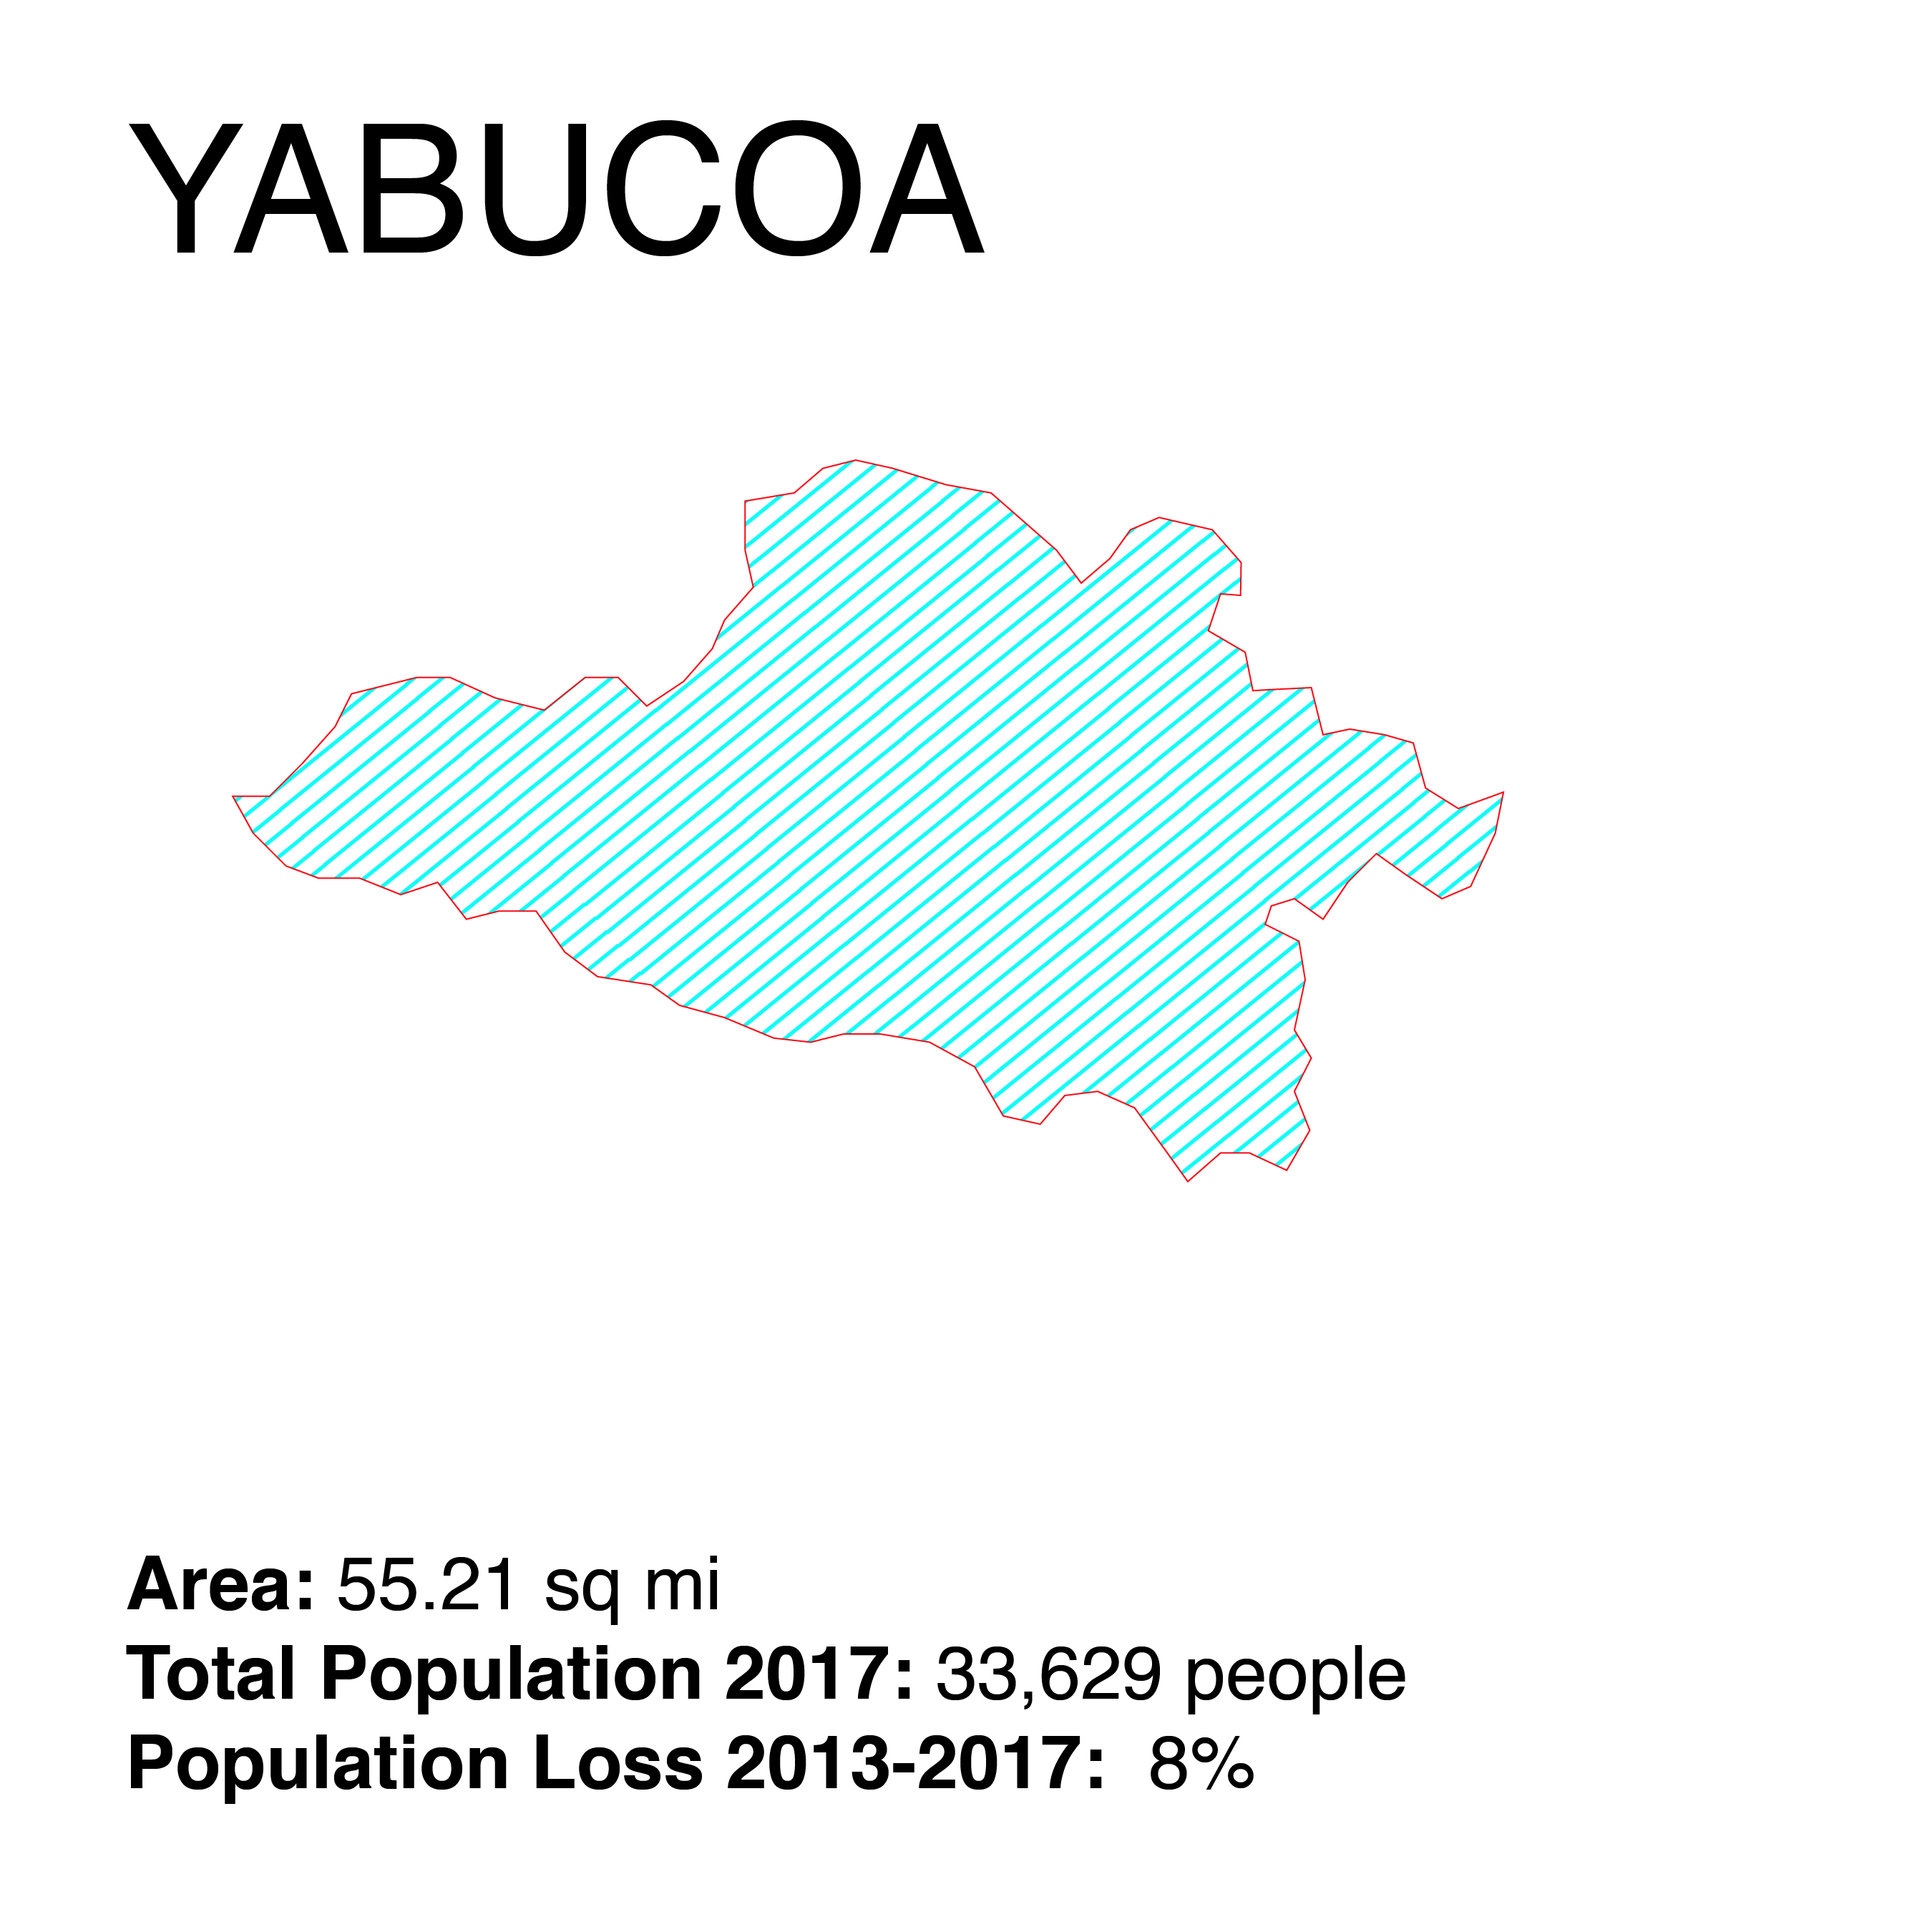
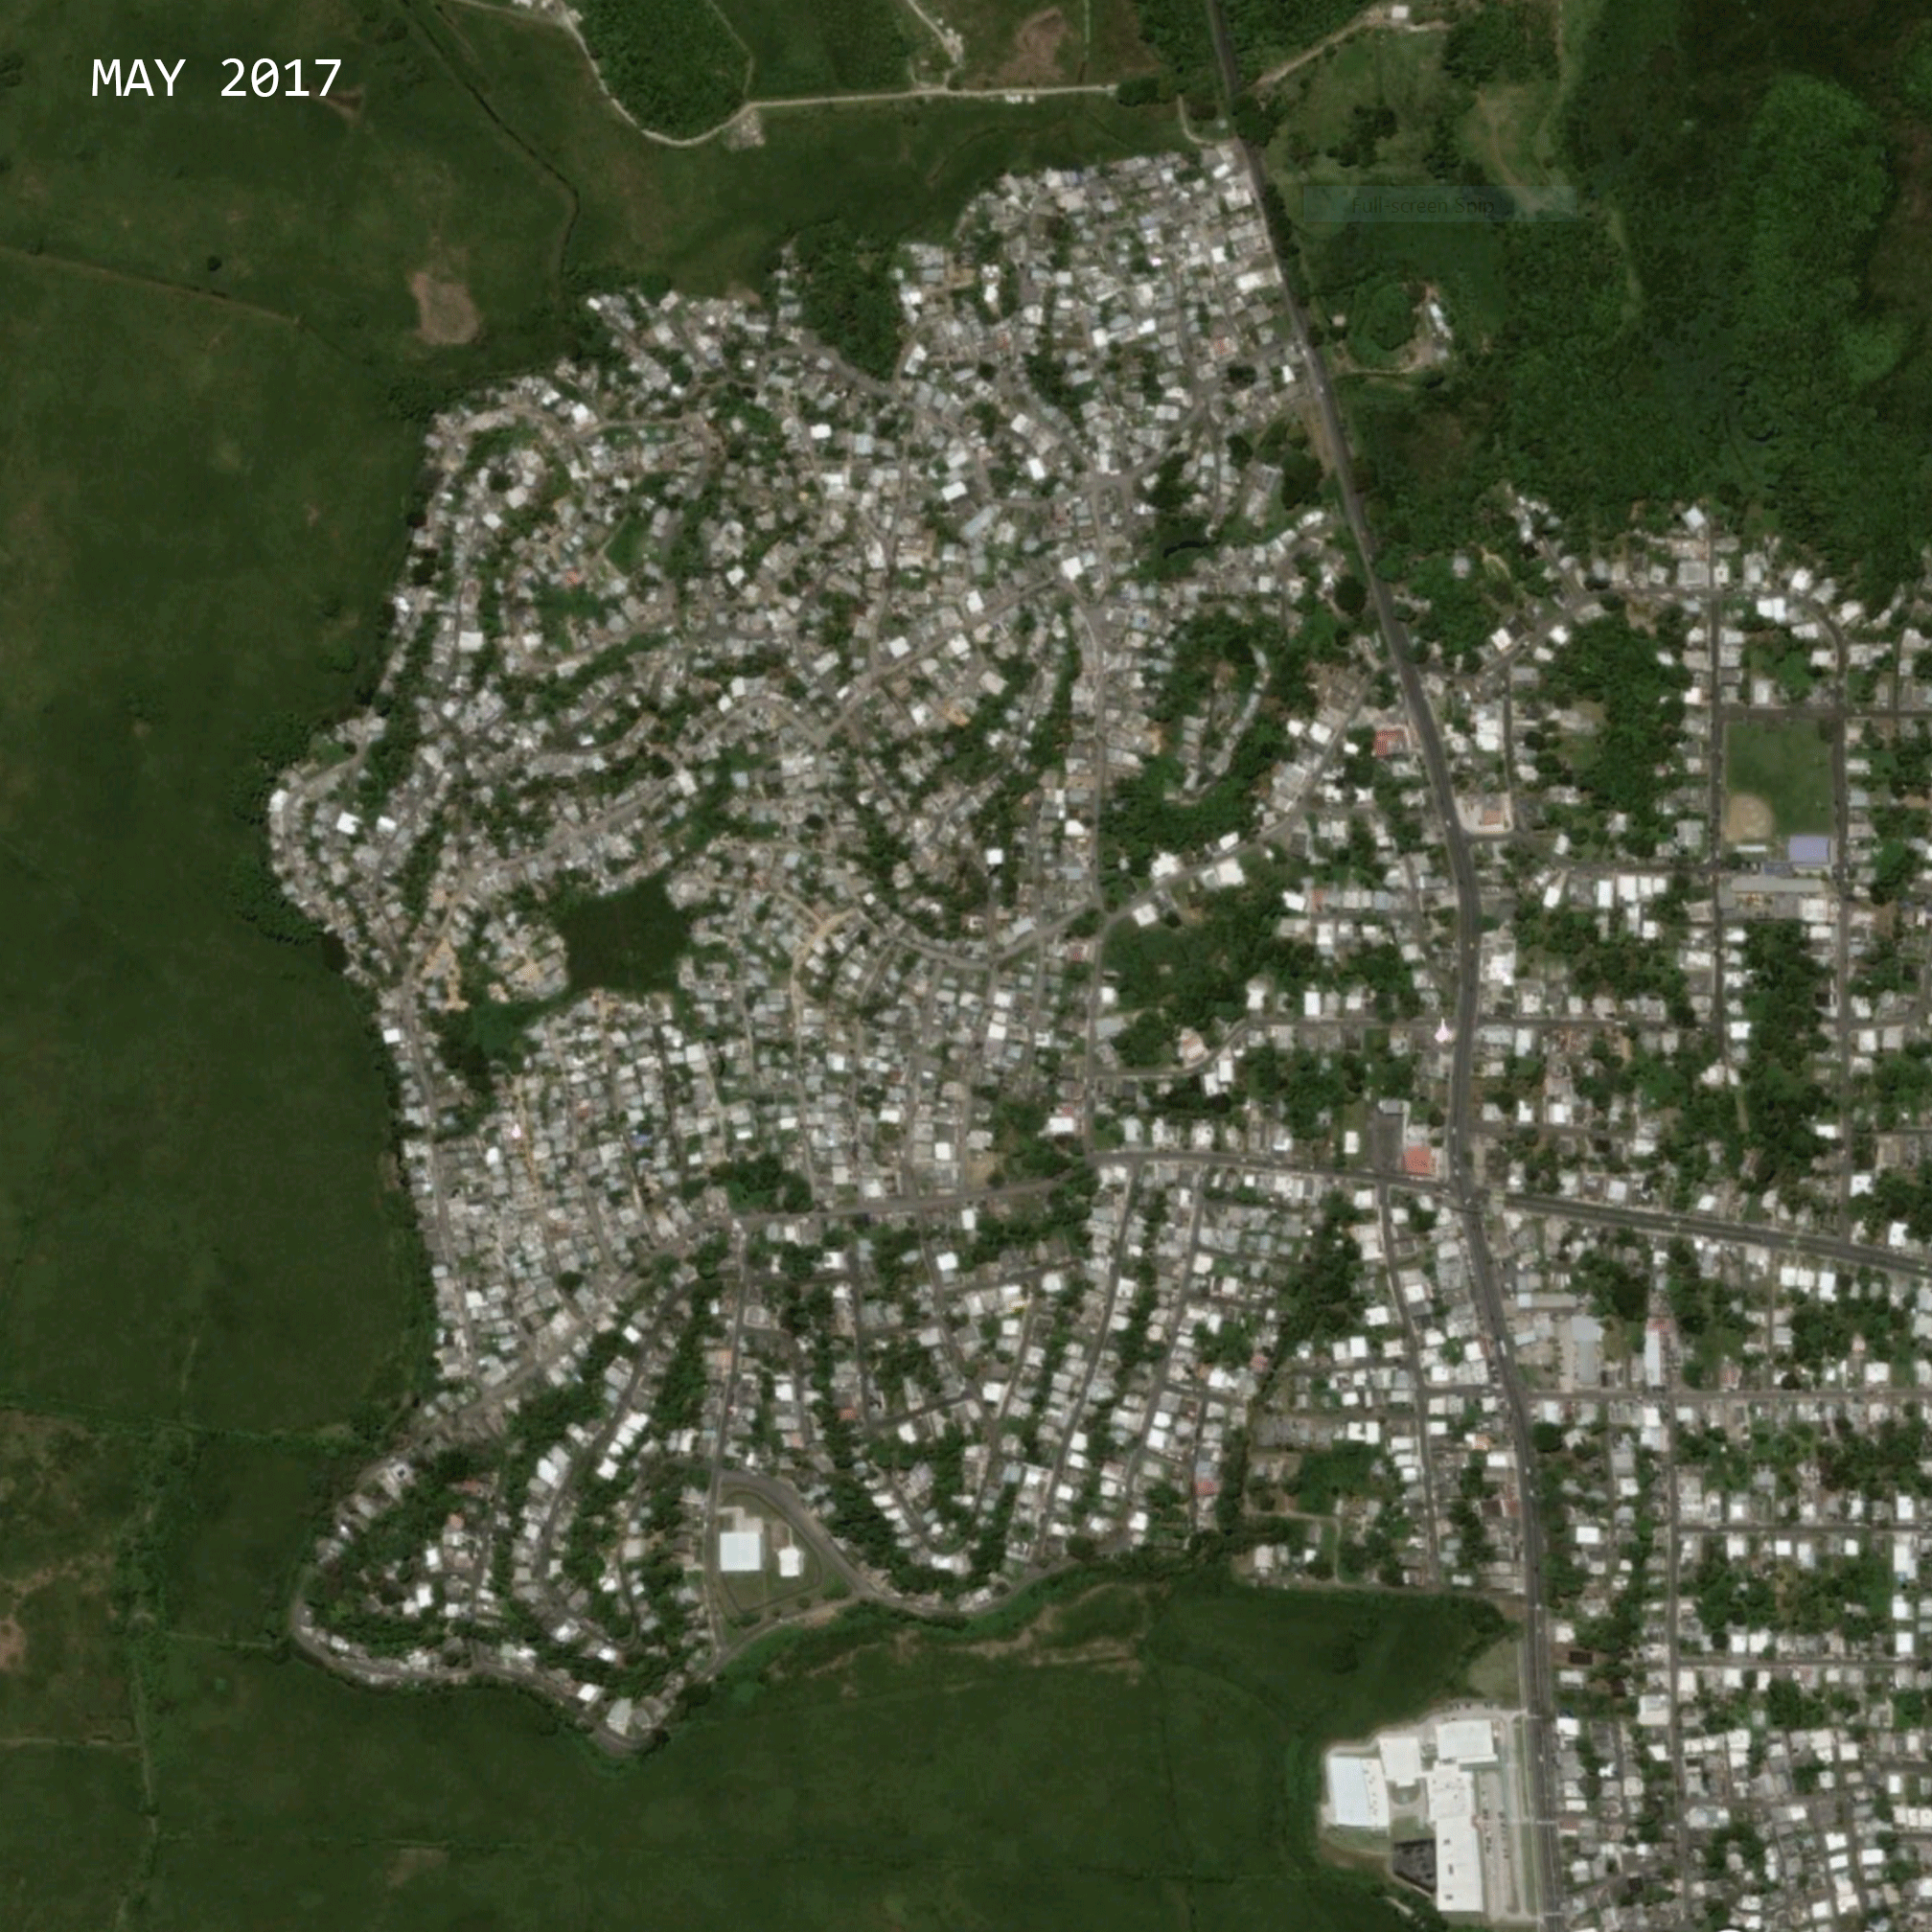
September 20. 6:15 a.m. It is the official time in which hurricane Maria, category 4 on the Saffir-Simpson scale, enters through Yabucoa. This is a southeastern town with ten barrios: Aguacate, Calabaza, Camino Nuevo, Guayabota, Jácana, Juan Marín, Limones, Playa, Pueblo, and Tejas. This area is known for its farmers and agricultural lands– mostly produces plantains all heavily affected by the storm(3,000 to 4,000 acres of plantains were destroyed.) -Read more about Yabucoa after María
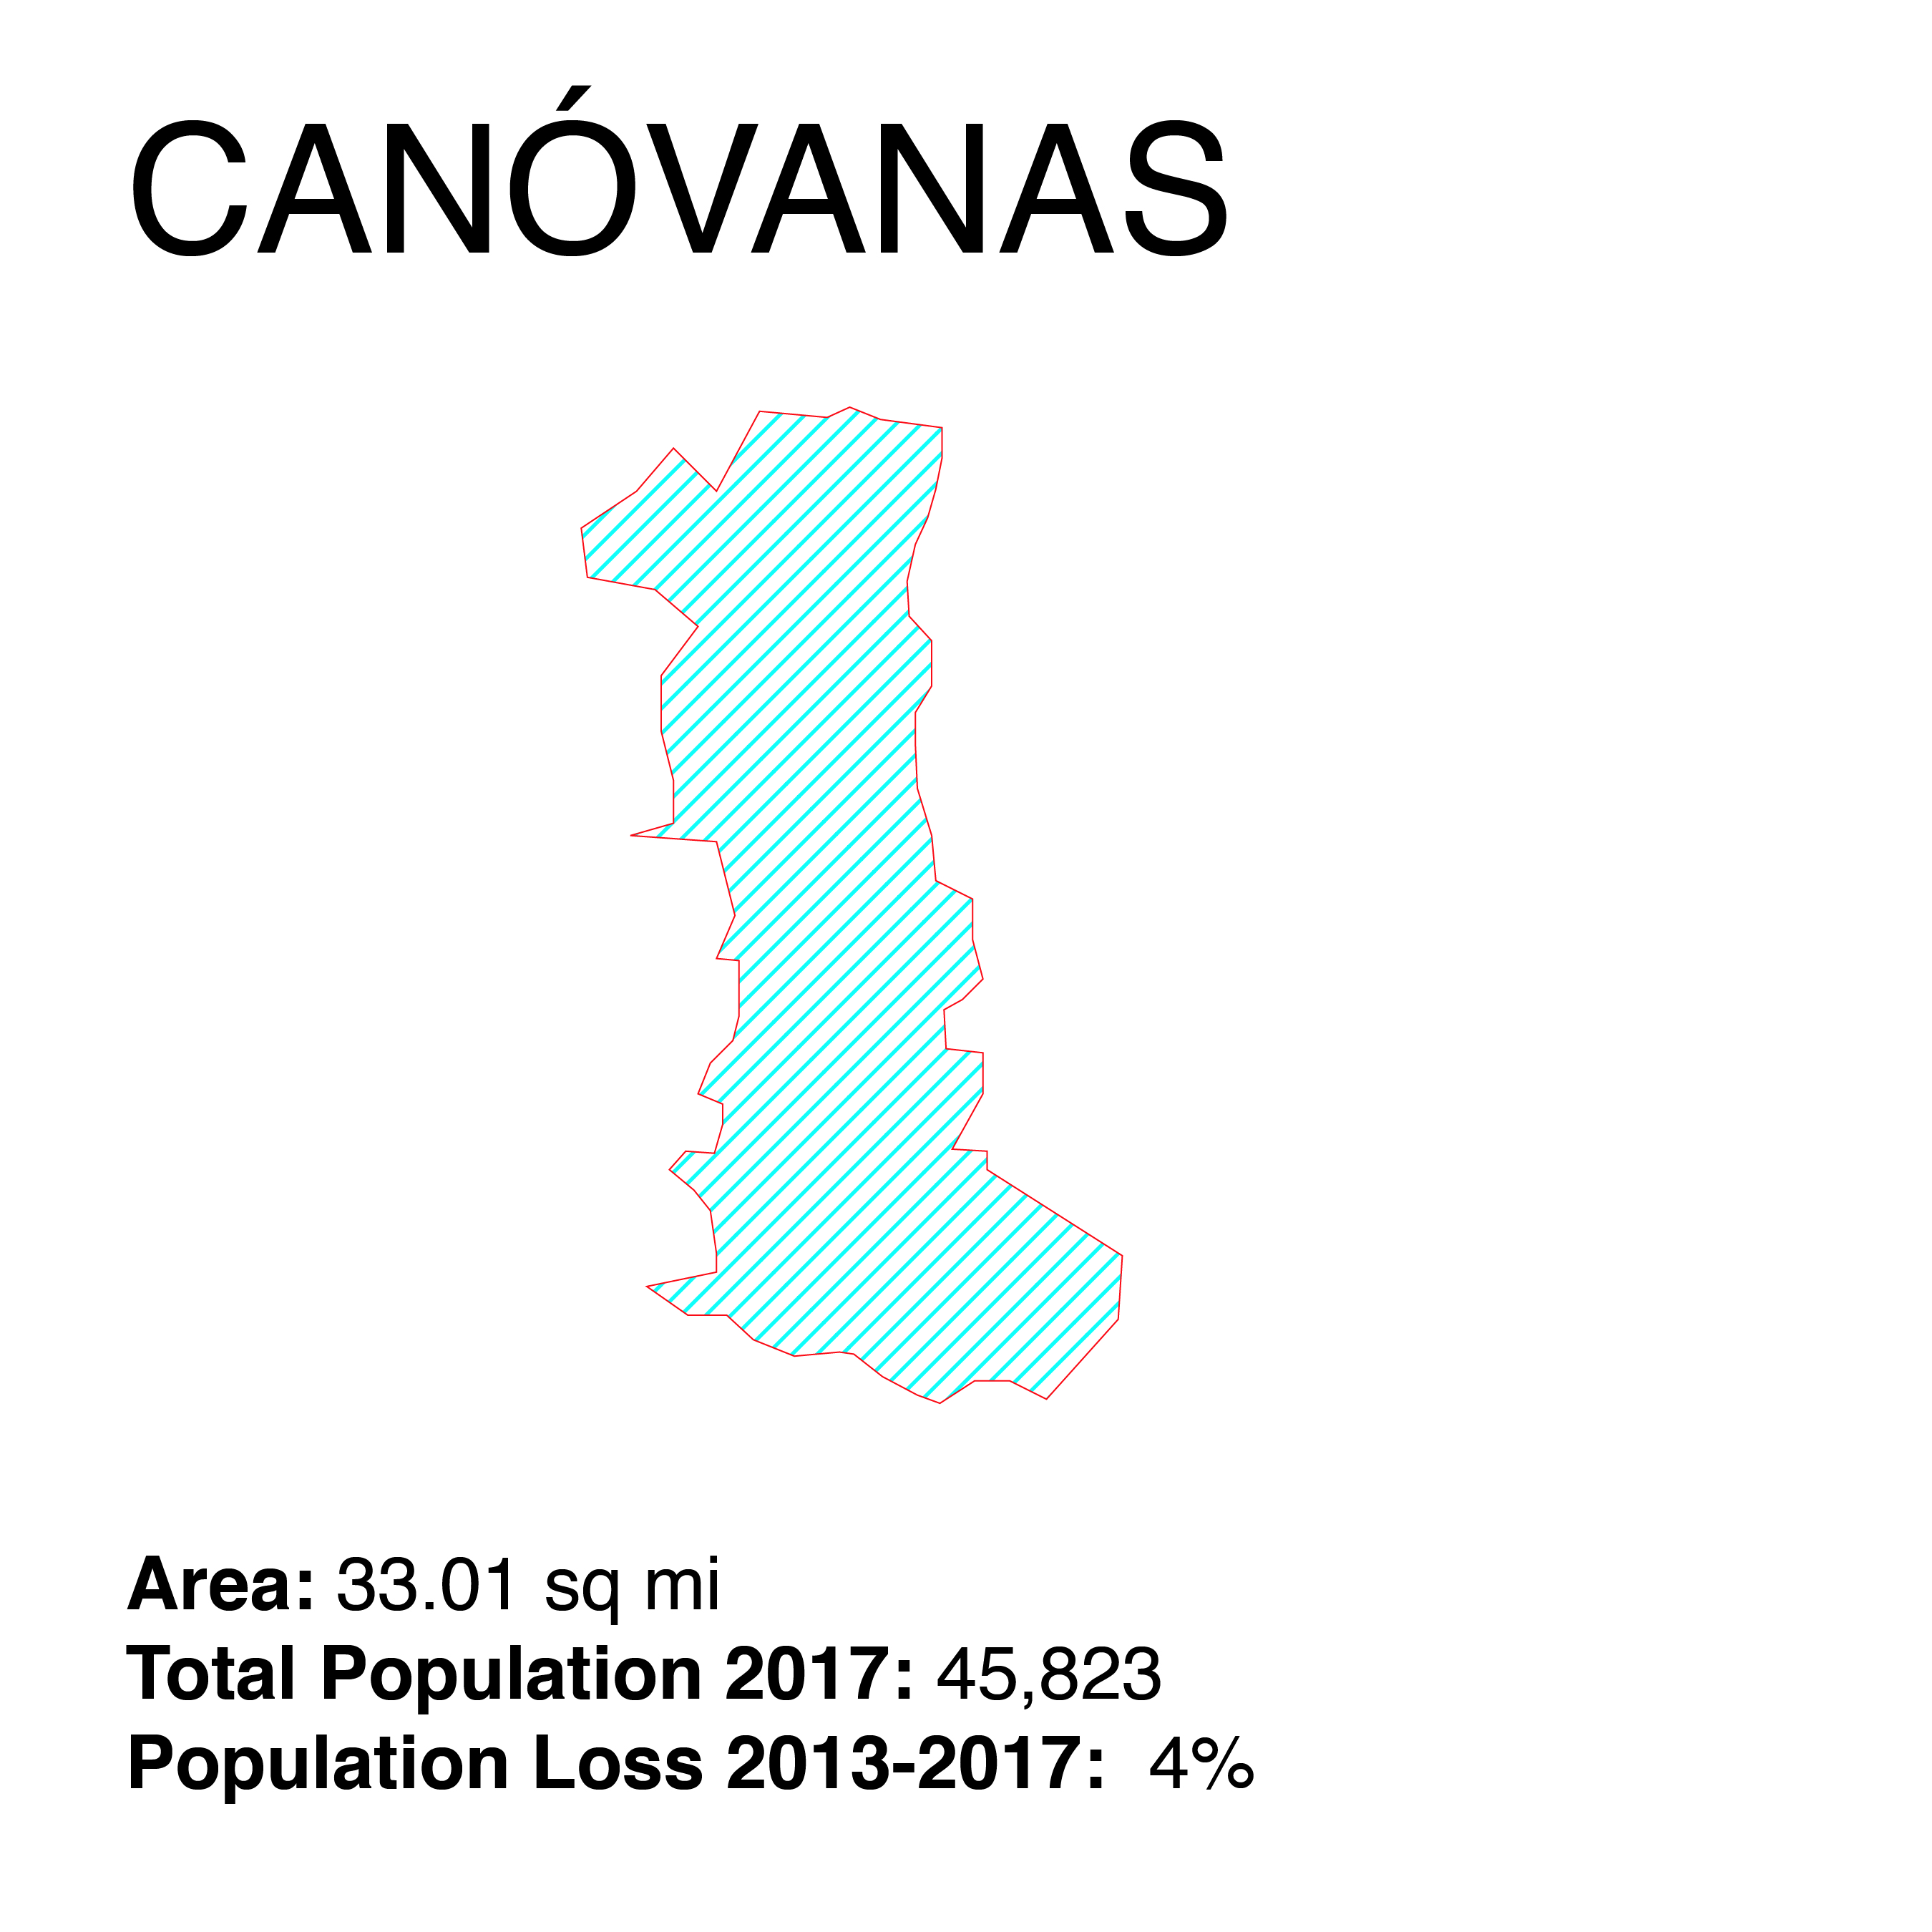
Canóvanas is located in the northeastern region including six barrios; Canóvanas Canóvanas barrio-pueblo, Cubuy, Hato Puerco, Lomas, and Torrecilla Alta. Since 2004, and based on law 1-2001, 19 communities in Canóvanaswere designated as Special Communities (Comunidades especiales) in Puerto Rico to address high levels of poverty and lack of resources and opportunities.Floods are typical during the storm season, between June and November. Most flat areas are subject to occasional flooding and flood-prone alluvial valley of the Río Grande de Loíza and its main tributaries, the Río Canóvanas and Río Canovanillas. According to local news and FEMA Canóvanas has the third-worst housing damages on the island, And yet, it is one of the towns with the largest number of housing units with unattended needs, according to municipal documents. -Read more about Canóvanas after María -link 2
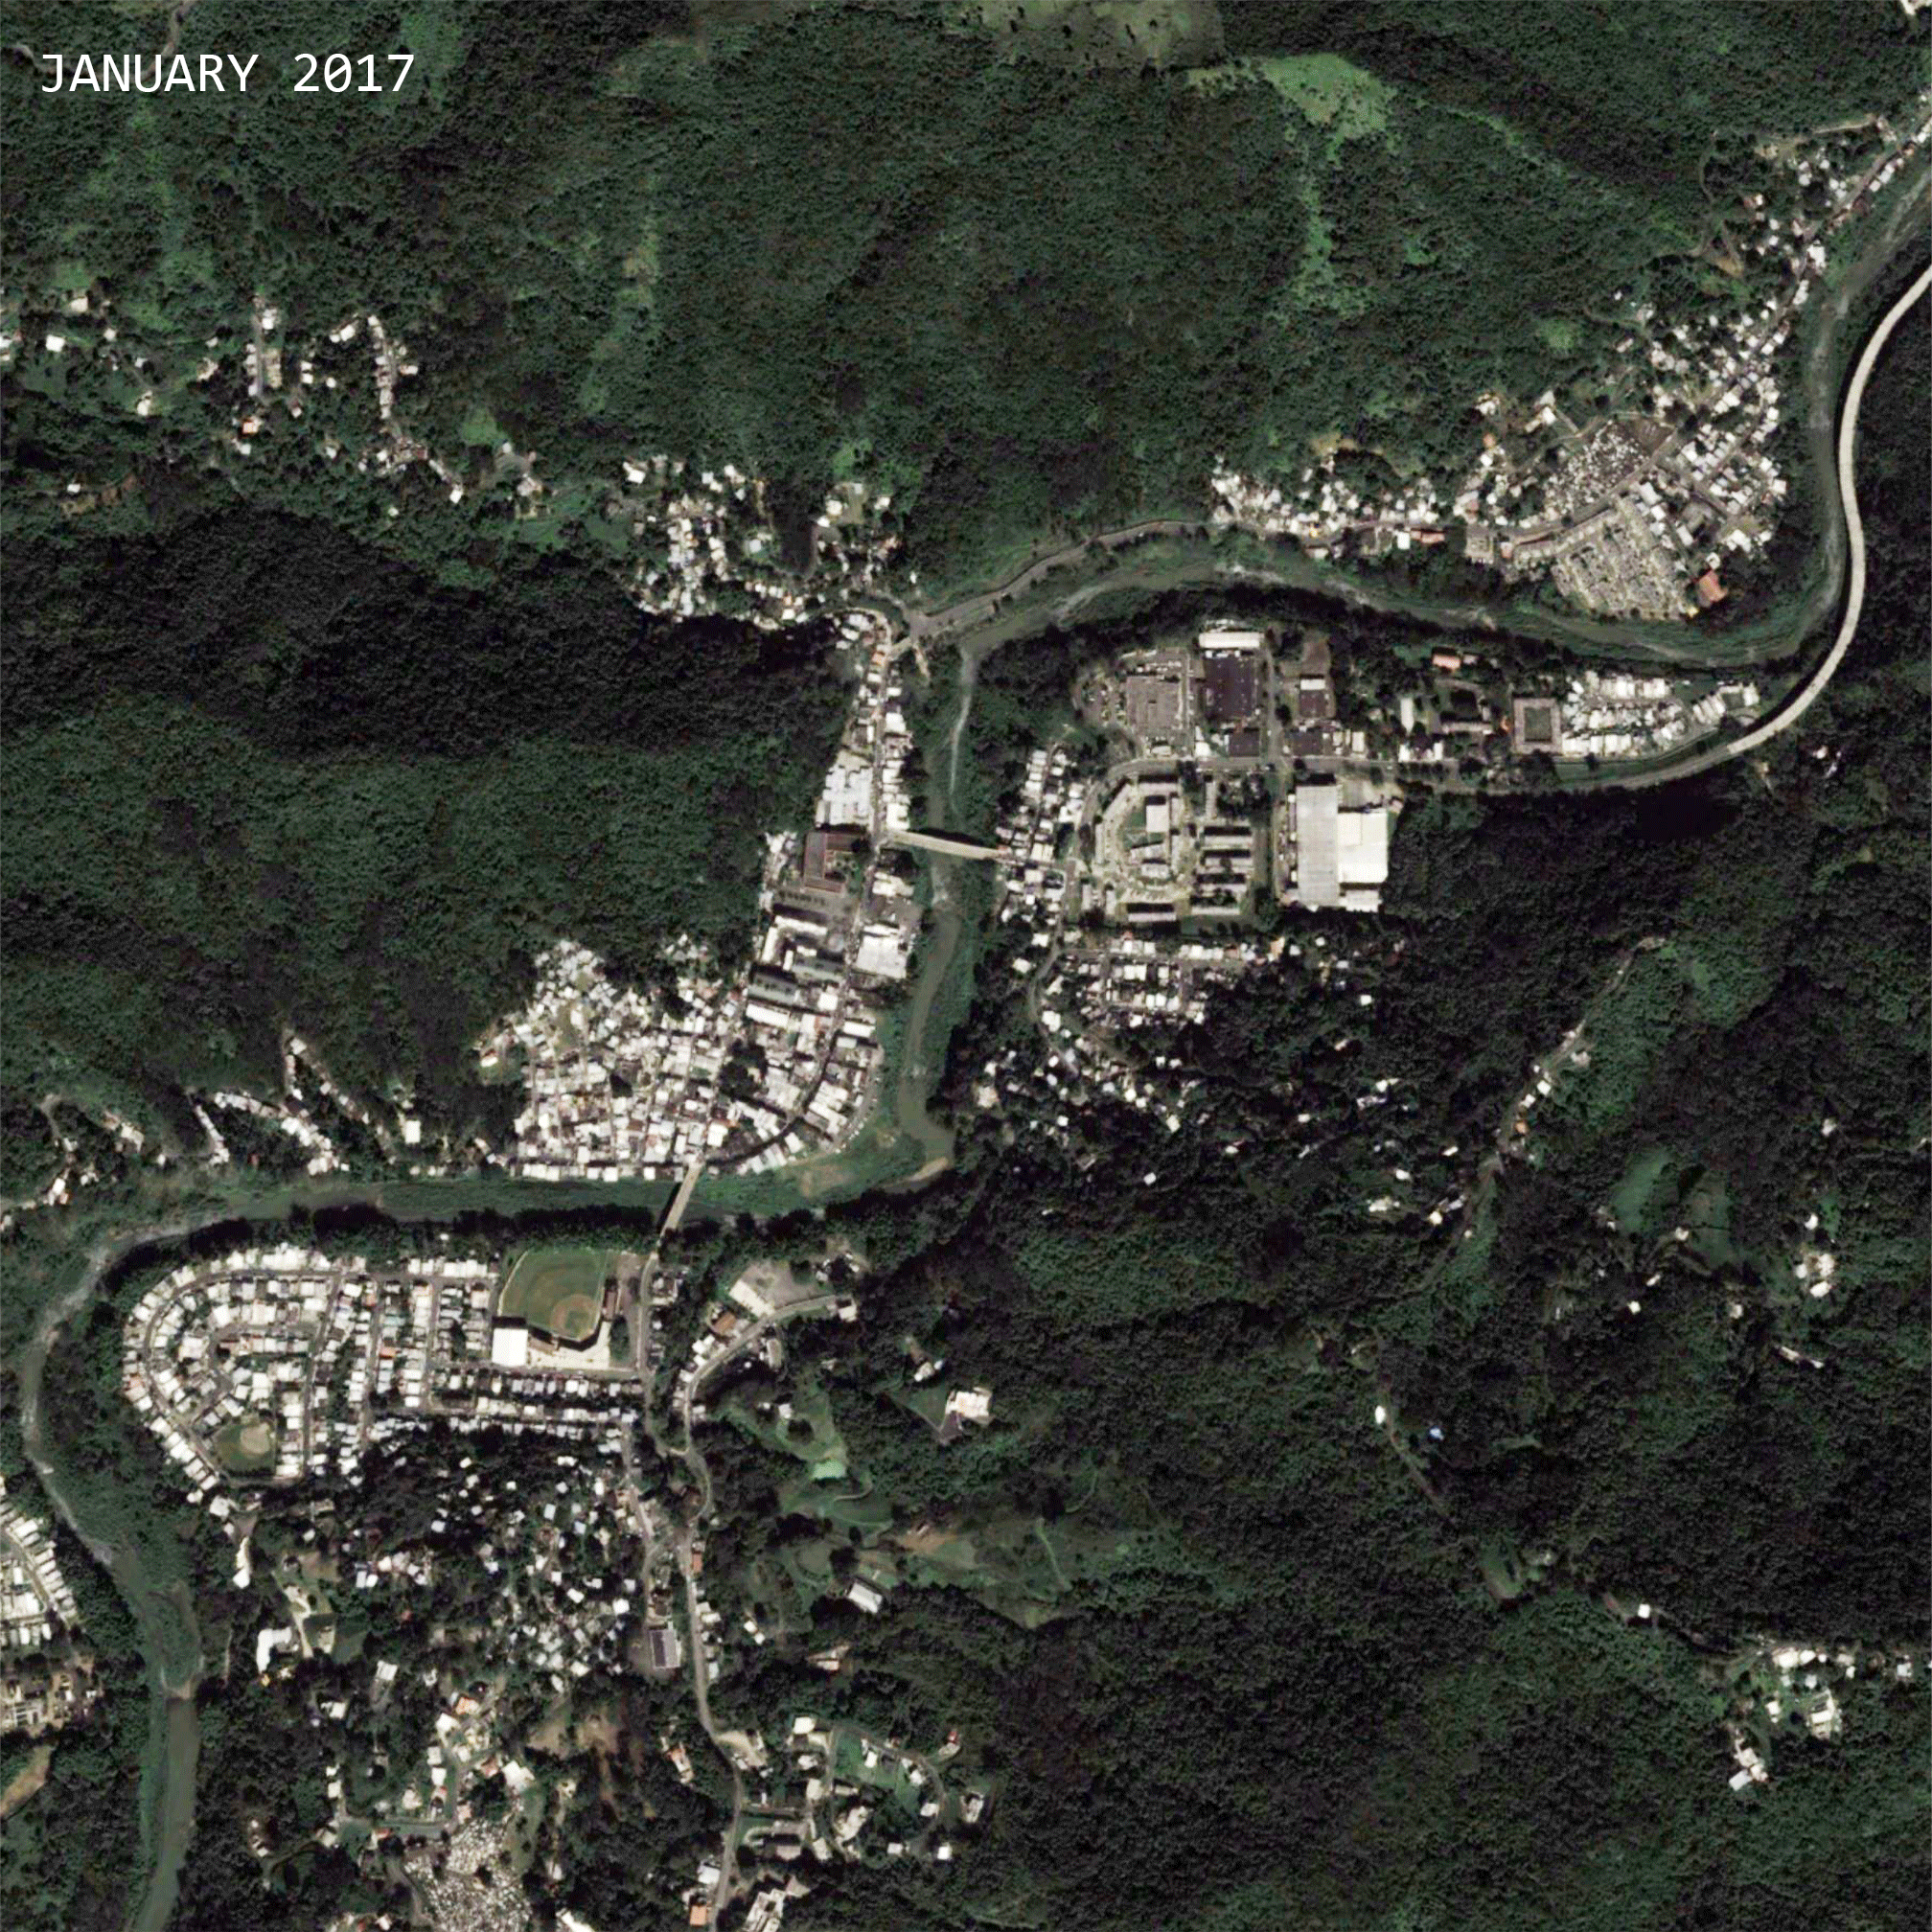
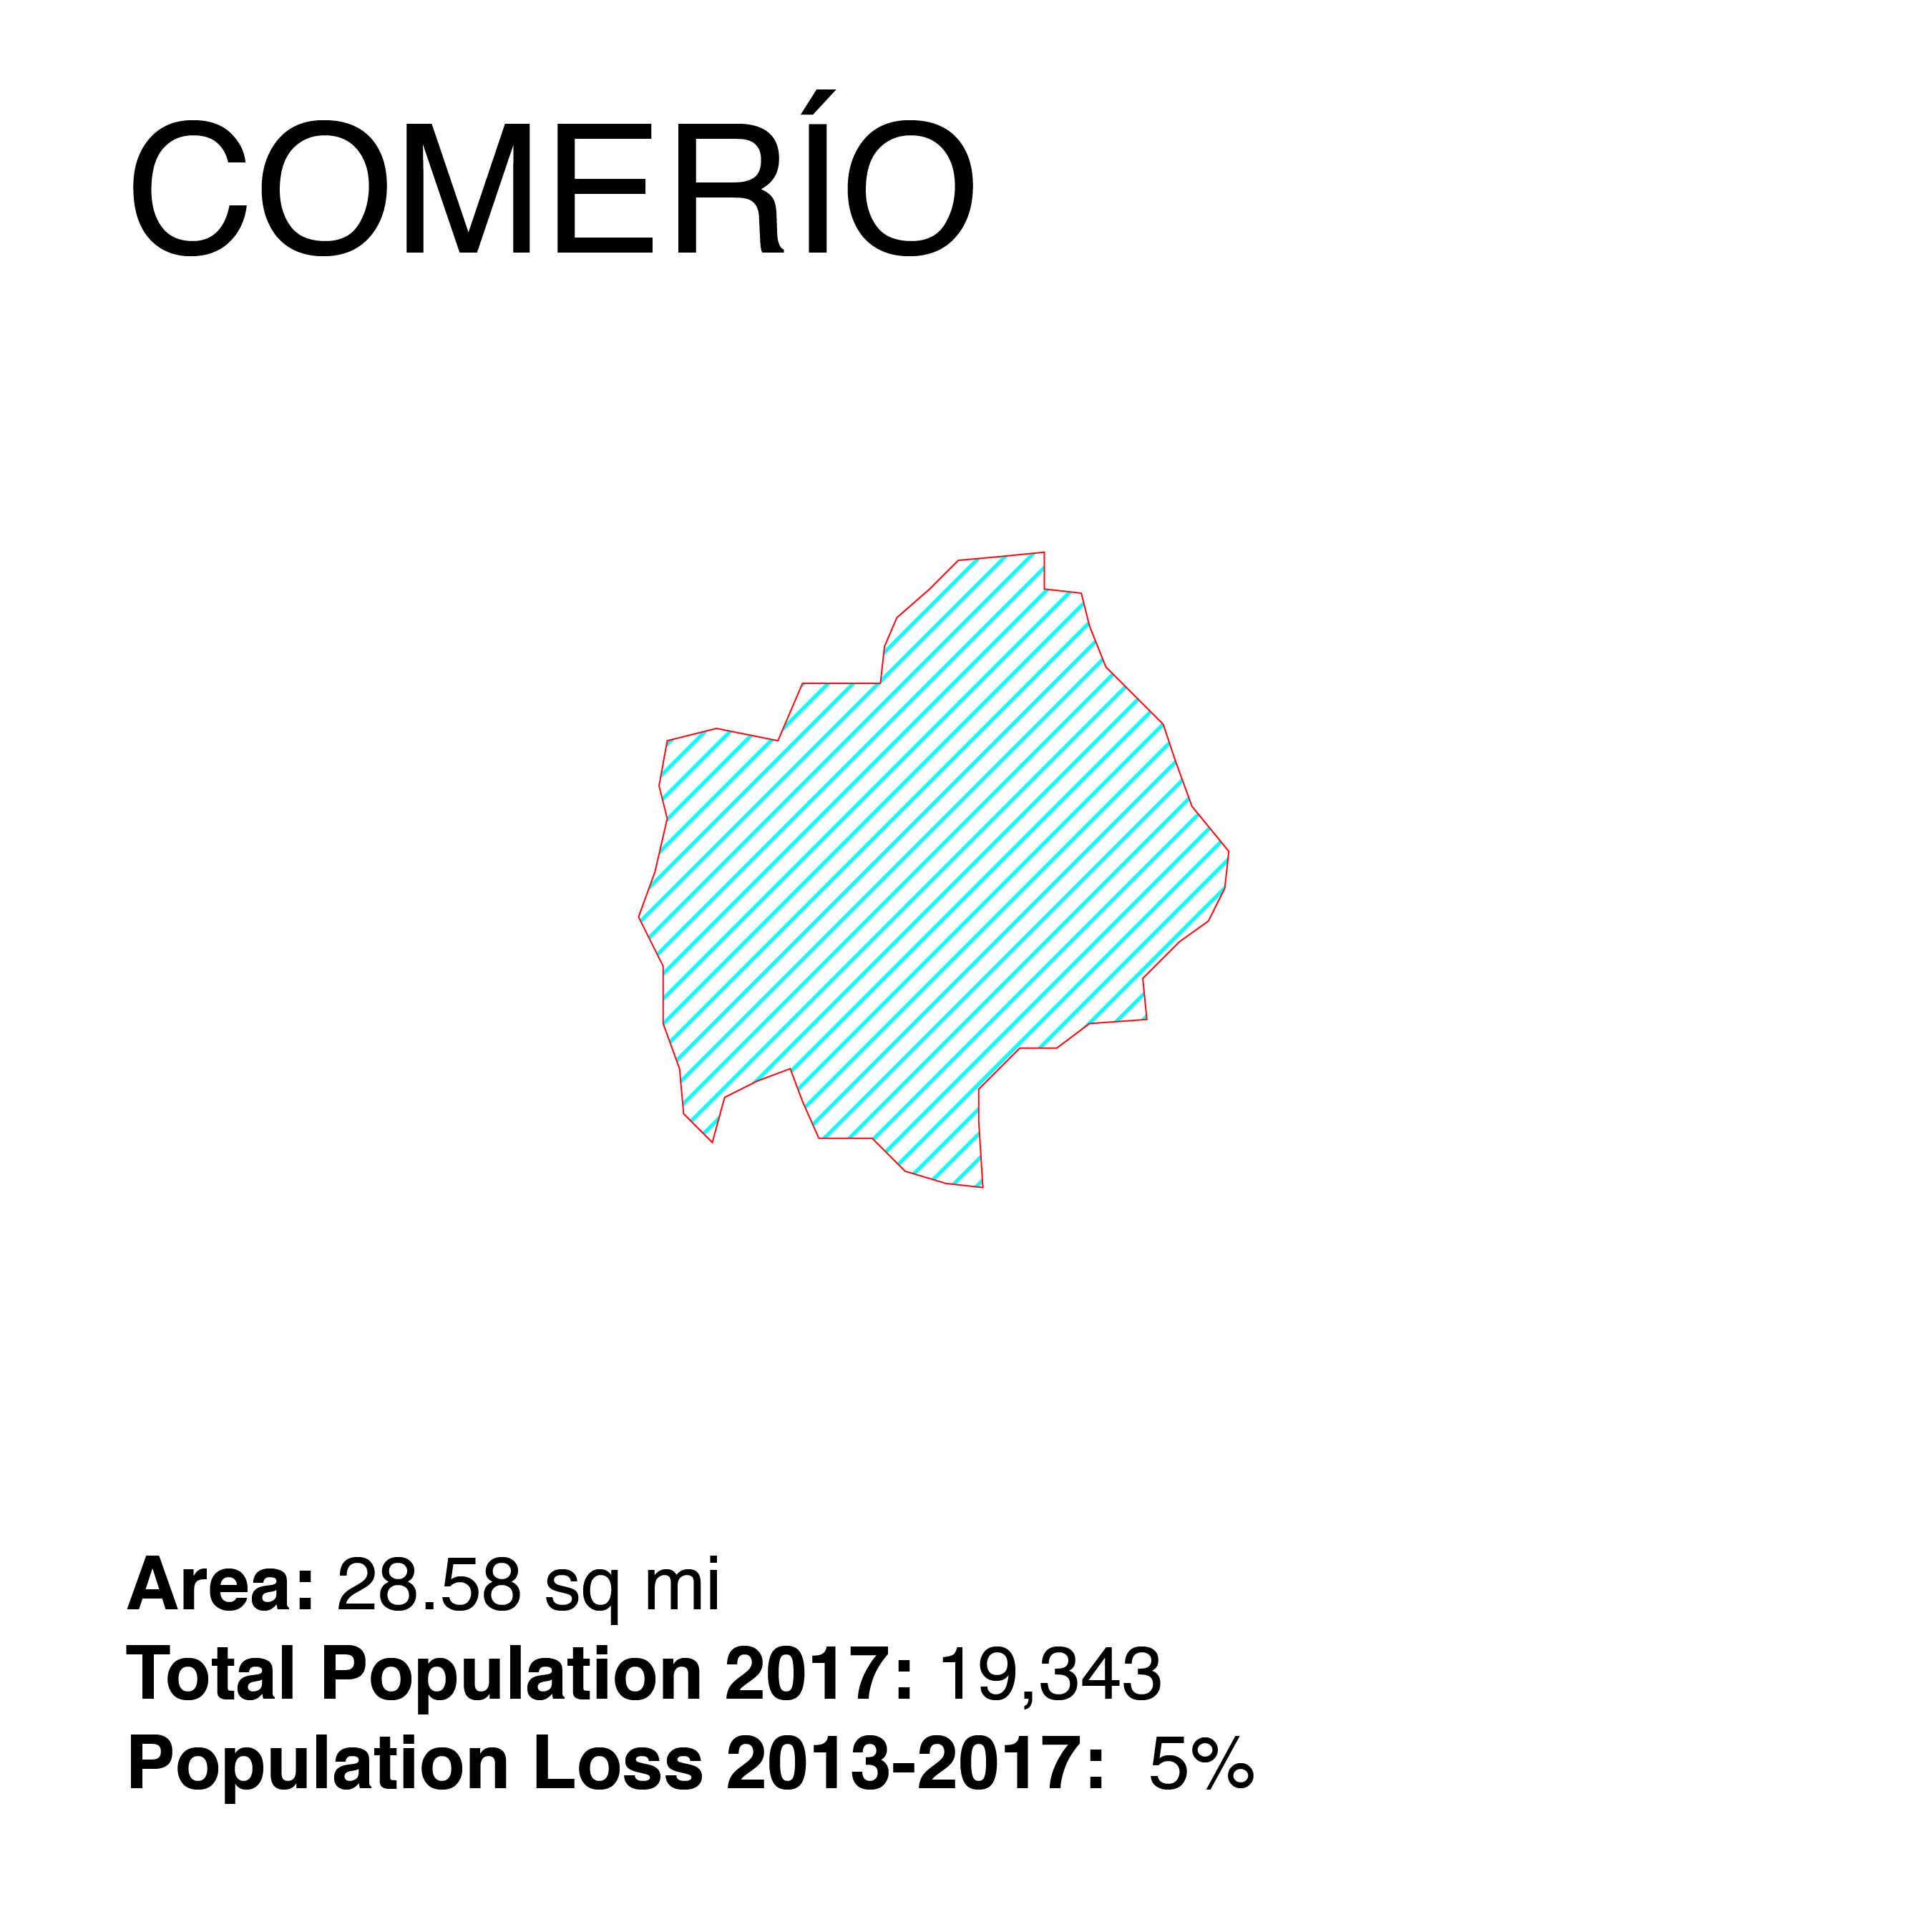
Comerío is located in the center-eastern region of the island and know for it closeness to the Río La Plata and by it mountainous region bot condition became a natural hazard since the river swelled by more than 60 feet causing inundation and landslides. -Read more about Comerío after María -link 2 -link 3 -VIDEO
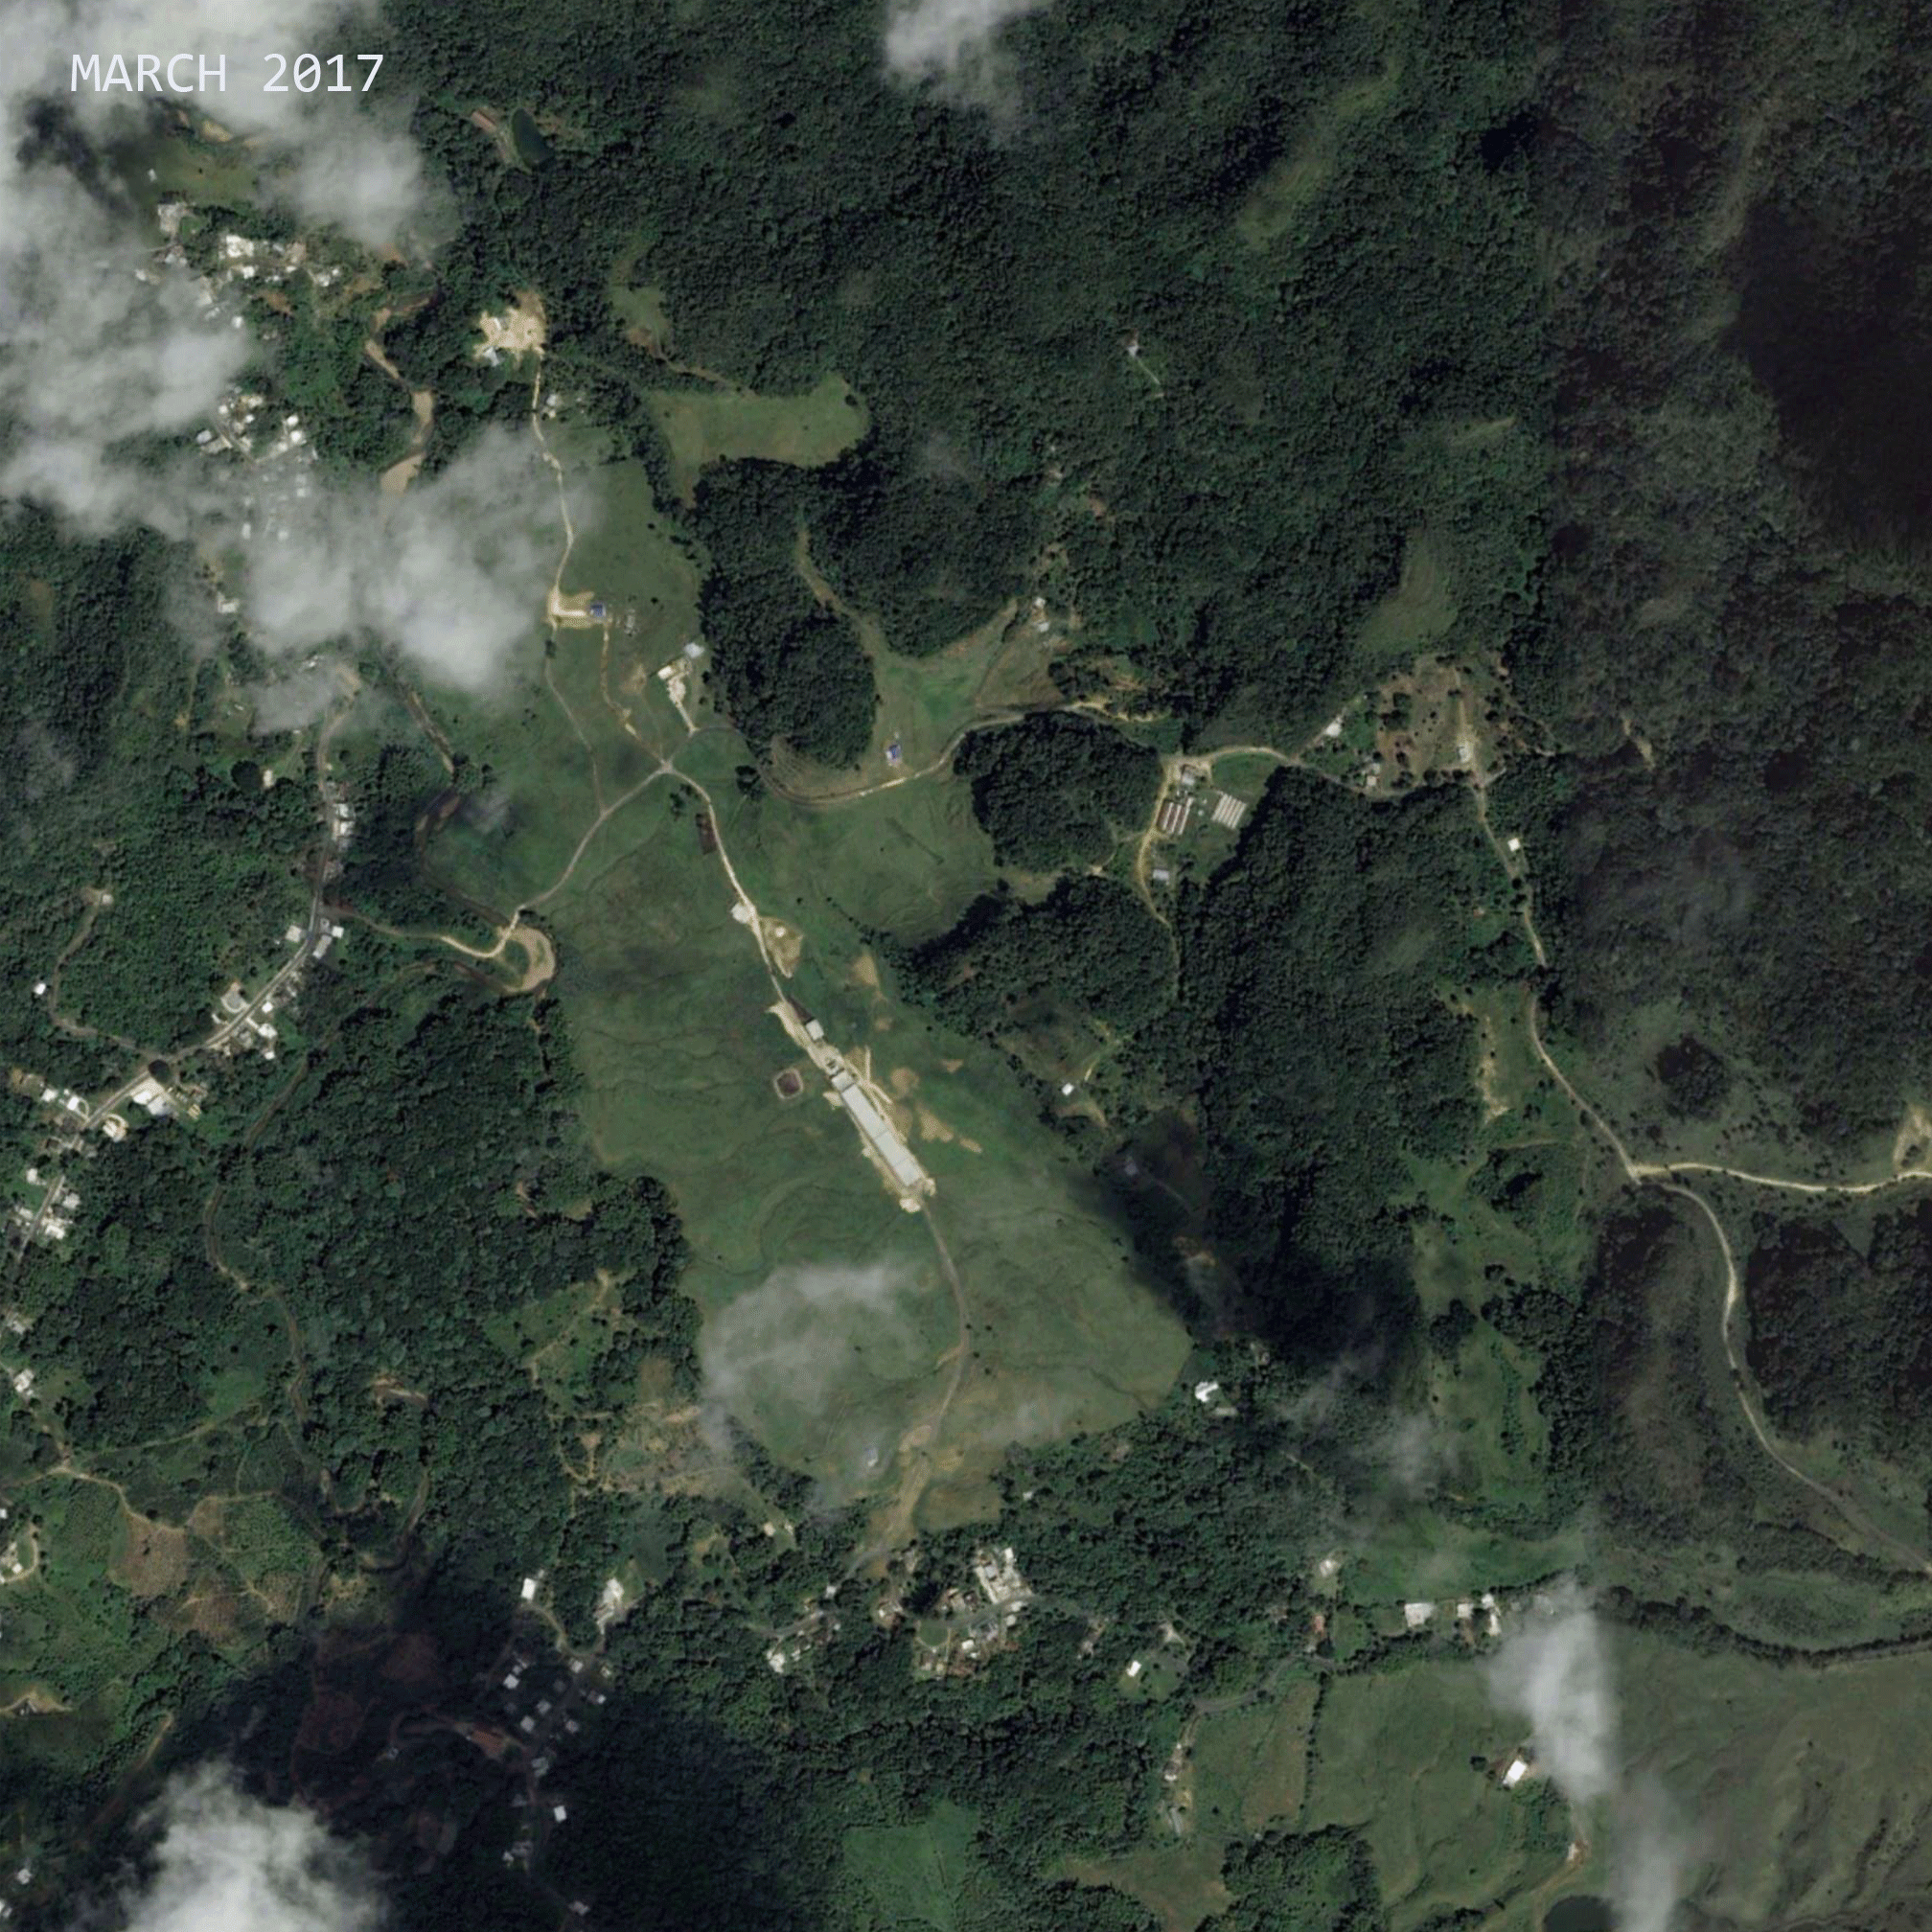
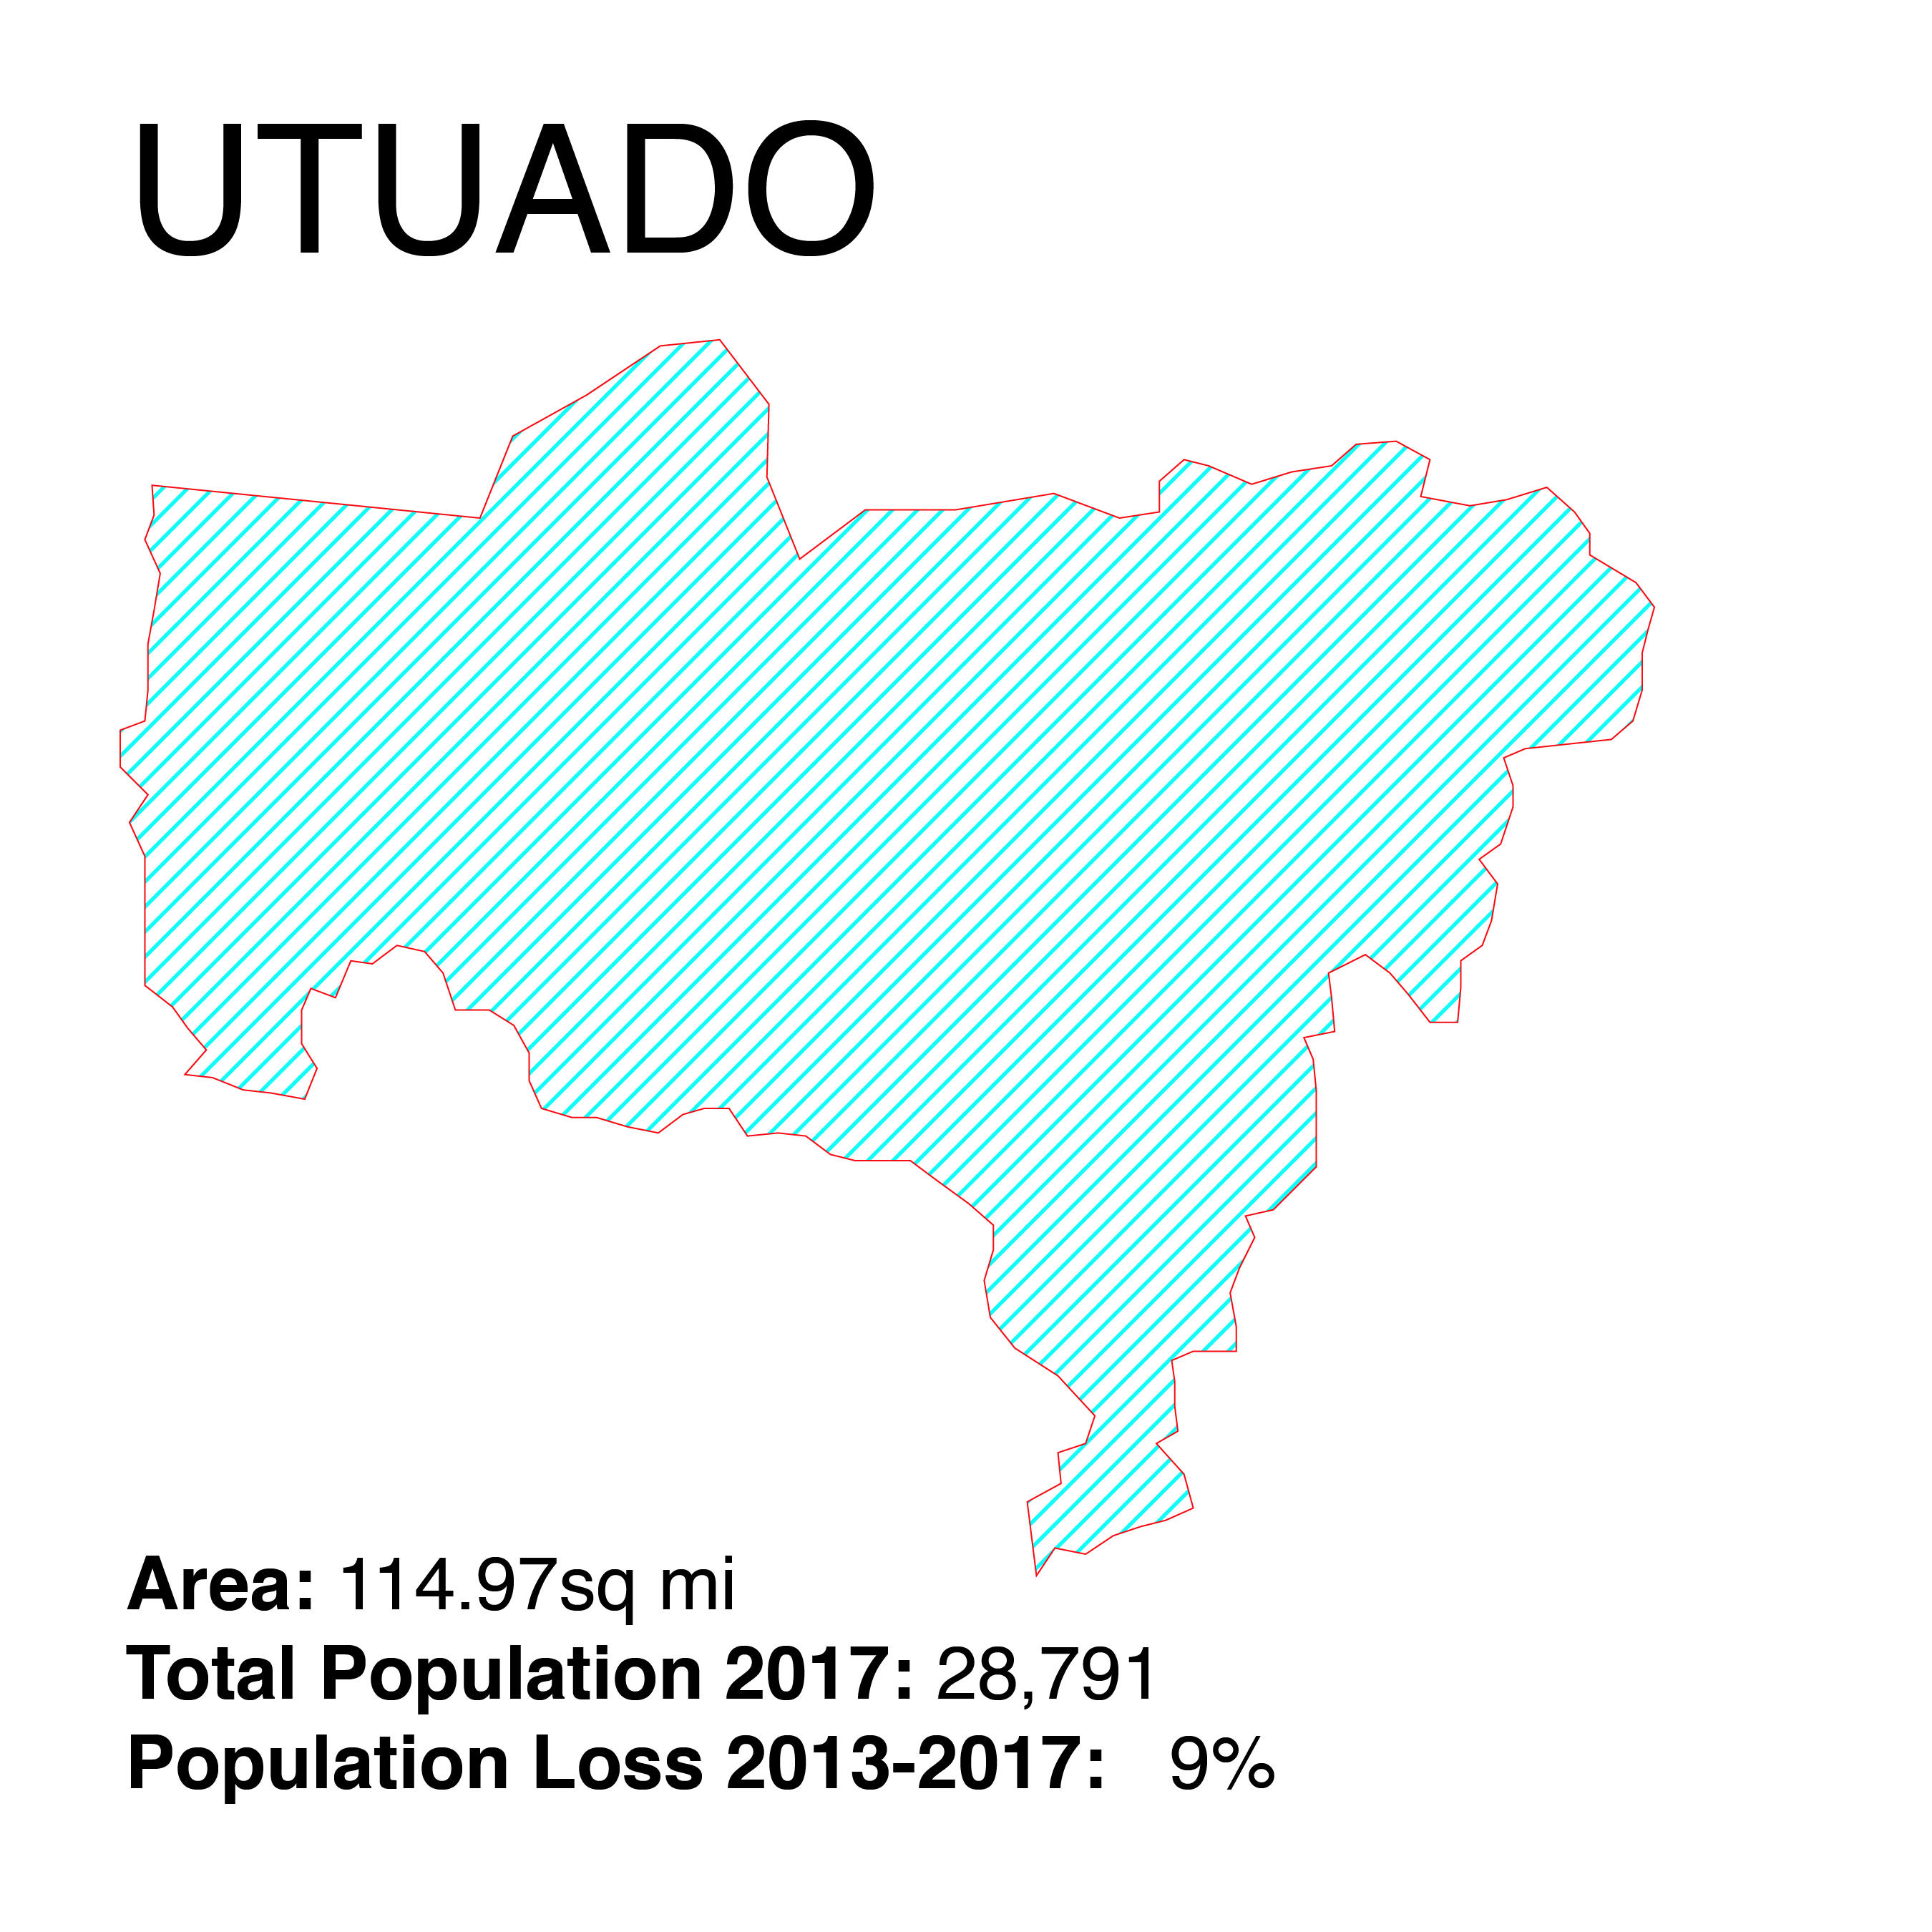
Utuado is located in the central mountainous region of the island known as La Cordillera Central provoking massive landslides and downed trees that blocked the accessibility for the whole town for weeks. Utuado is also under a critical situation not only by nature but also because man made hazards as the unmaintained the reservoirs of Dos Bocas has not been cleaned in decades hindering it capacity to retain water. Almost everything got washed out or covered with dirt when the combination of storm rain, full reservoir and destruction went out of control for the rural communities. -Watch these videos about Utuado after María- VIDEO 1 -VIDEO 2 -VIDEO 3
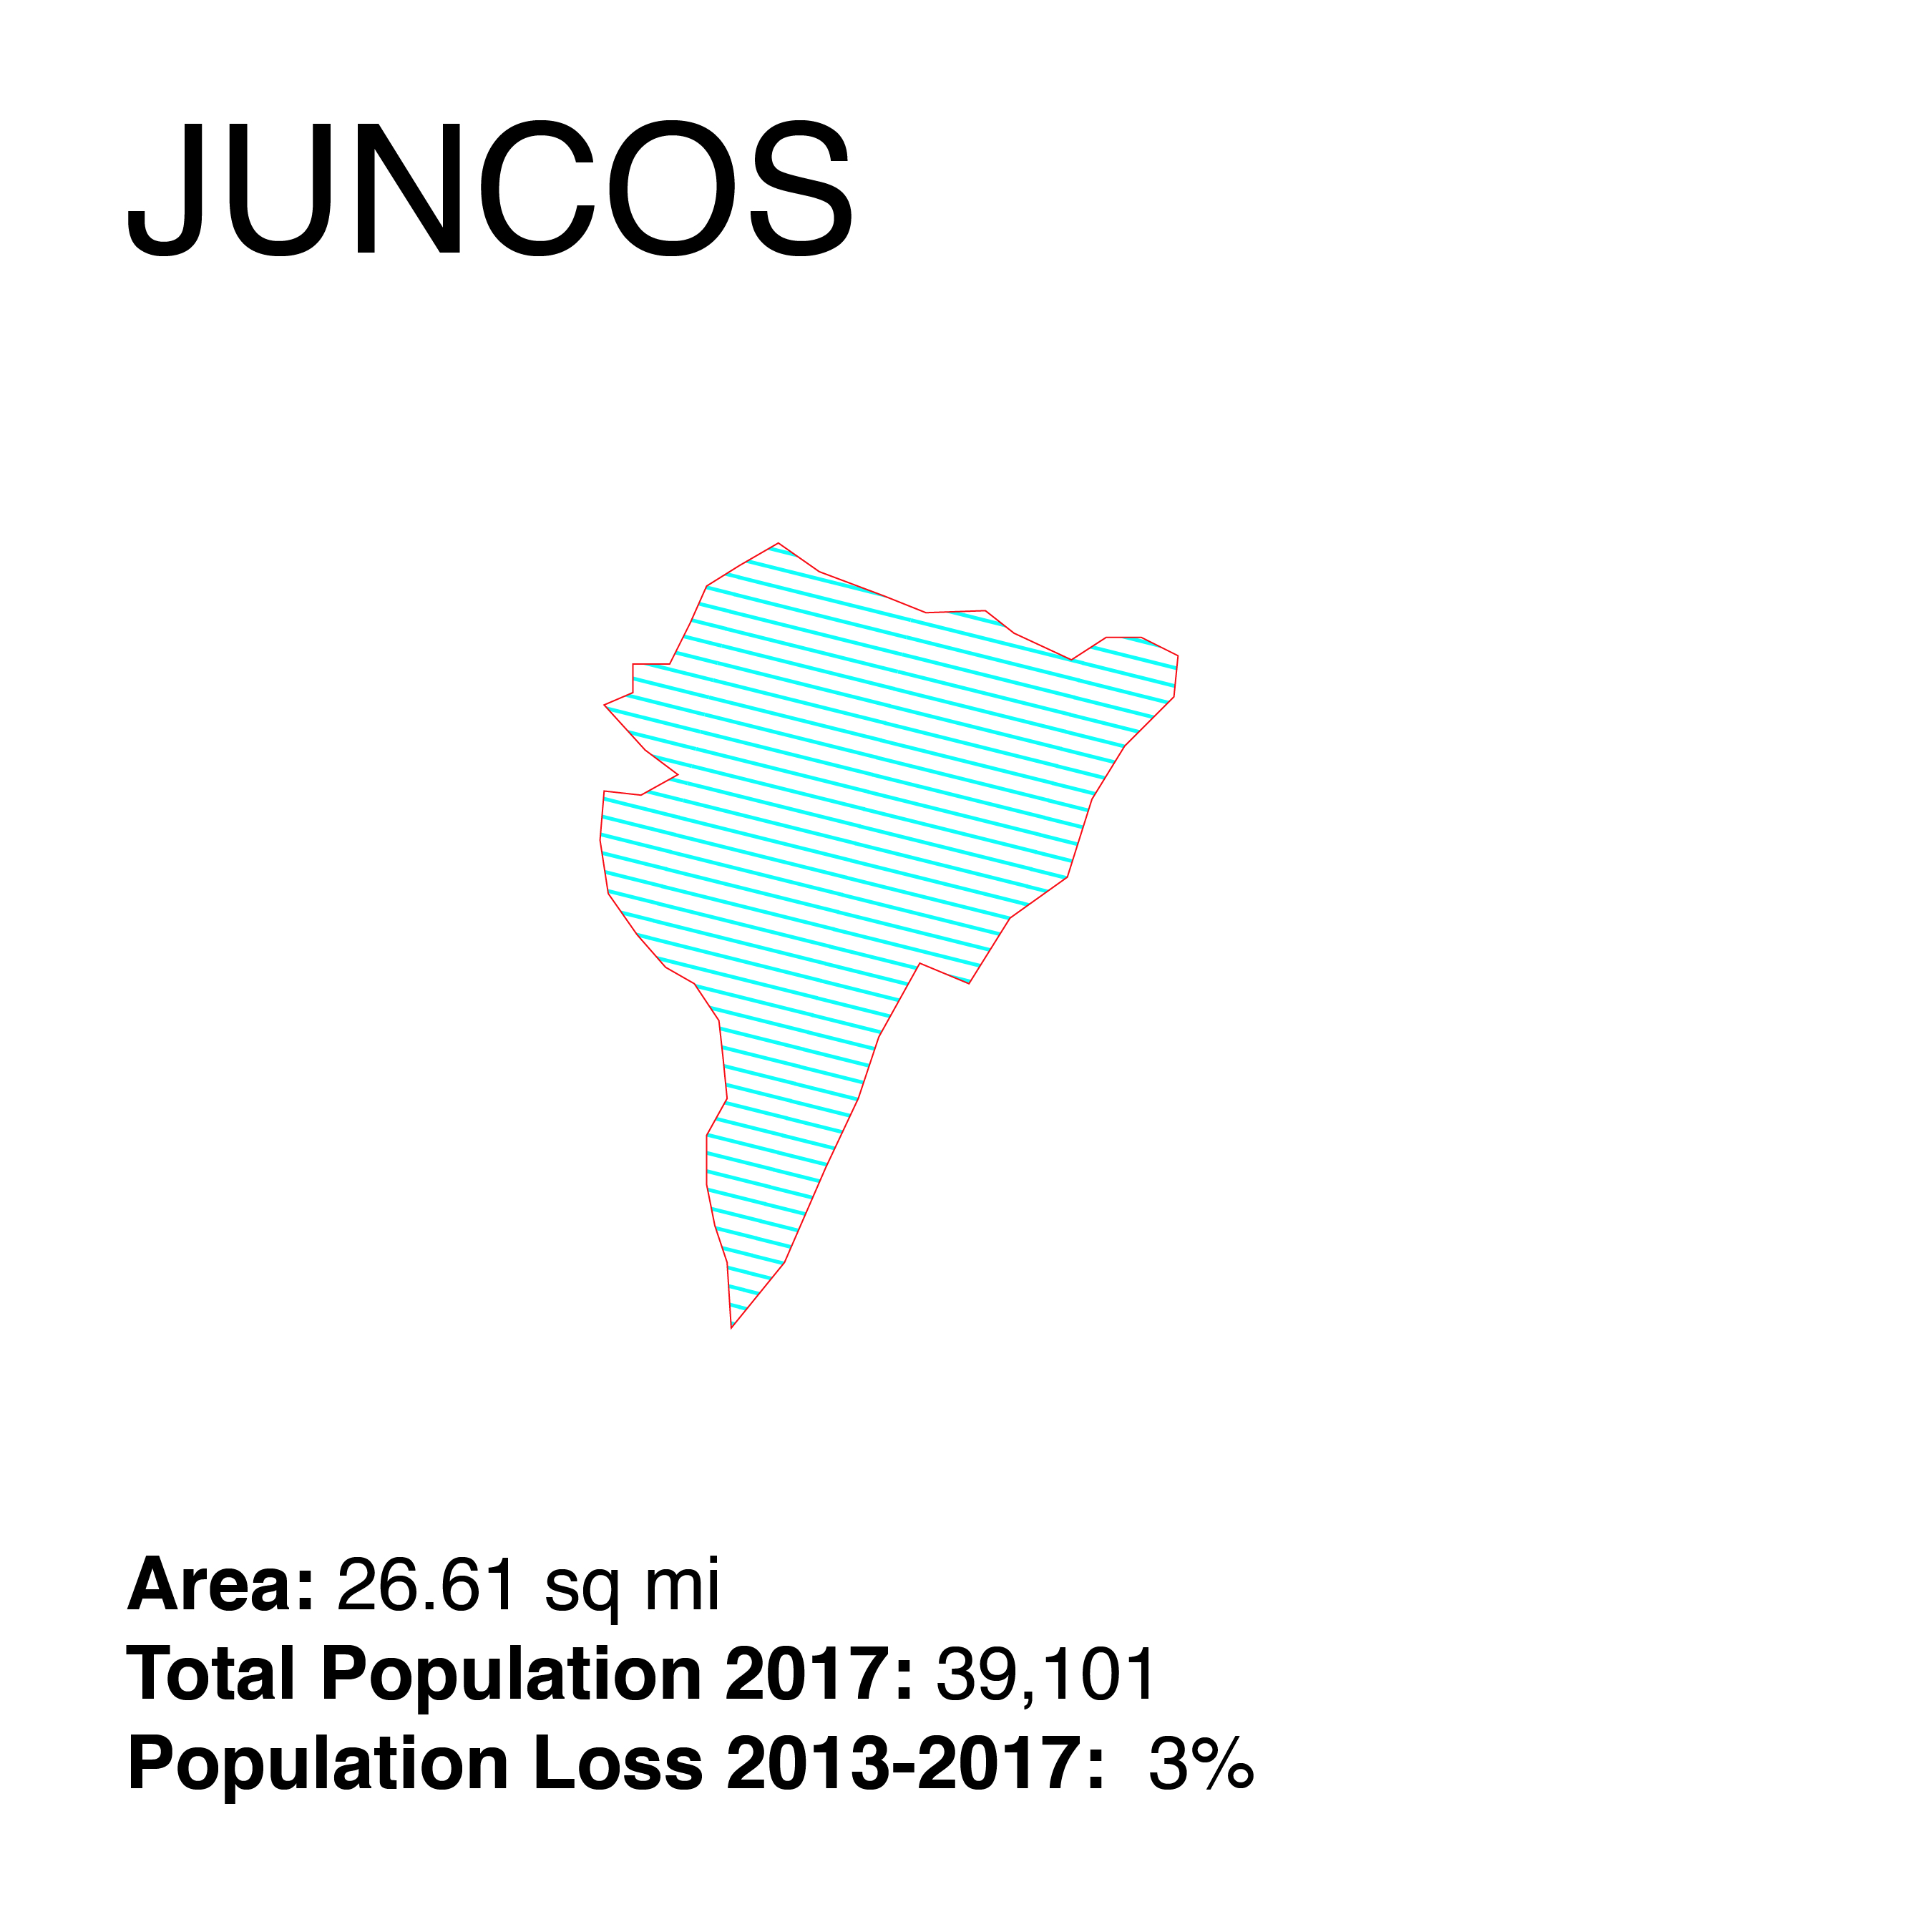
Juncos is located in the eastern central region of the island, including ten barrios: Caimito, Ceiba Norte, Ceiba Sur, Gurabo Abajo, Gurabo Arriba, Juncos barrio-pueblo, Lirios, Mamey Valenciano Abajo, and Valenciano Arriba. Since 2004, and based on law 1-2001, 8 communities in Juncos were designated as Special Communities (Comunidades especiales) in Puerto Rico to address high levels of poverty and lack of resources and opportunities; Flores, Santana 1 in Ceiba Norte, Canta Gallo, El Caracol, La Cuesta, Sector El Mangó, La Hormiga, Lirios Dorados, Hoyo Hondo Rosalía, Sector El Mangó. Juncos was declared a disaster area by the passage of Irma and María aggravated the situation to worst conditions since it triggered numerous landslides. Juncos reported more than 1,000 people without roofs. At the same time this town reported problems of access to drinking water, gasoline, diesel and electricity, affected by landslides, floods and the fall of a large part of the power line that keeps almost 50 percent of its residents without electricity. Based on local news the most affected sectors of Juncos were; La Placita, La Coroza, Mamey, Jacaranda, Mango (sectors Campo Alegre and Rosalia), Valenciano Arriba and Valenciano Abajo, as well as highways PR-198, PR-183, PR-185 and PR-919. -Read more about Juncos after María -link 2 -link 3
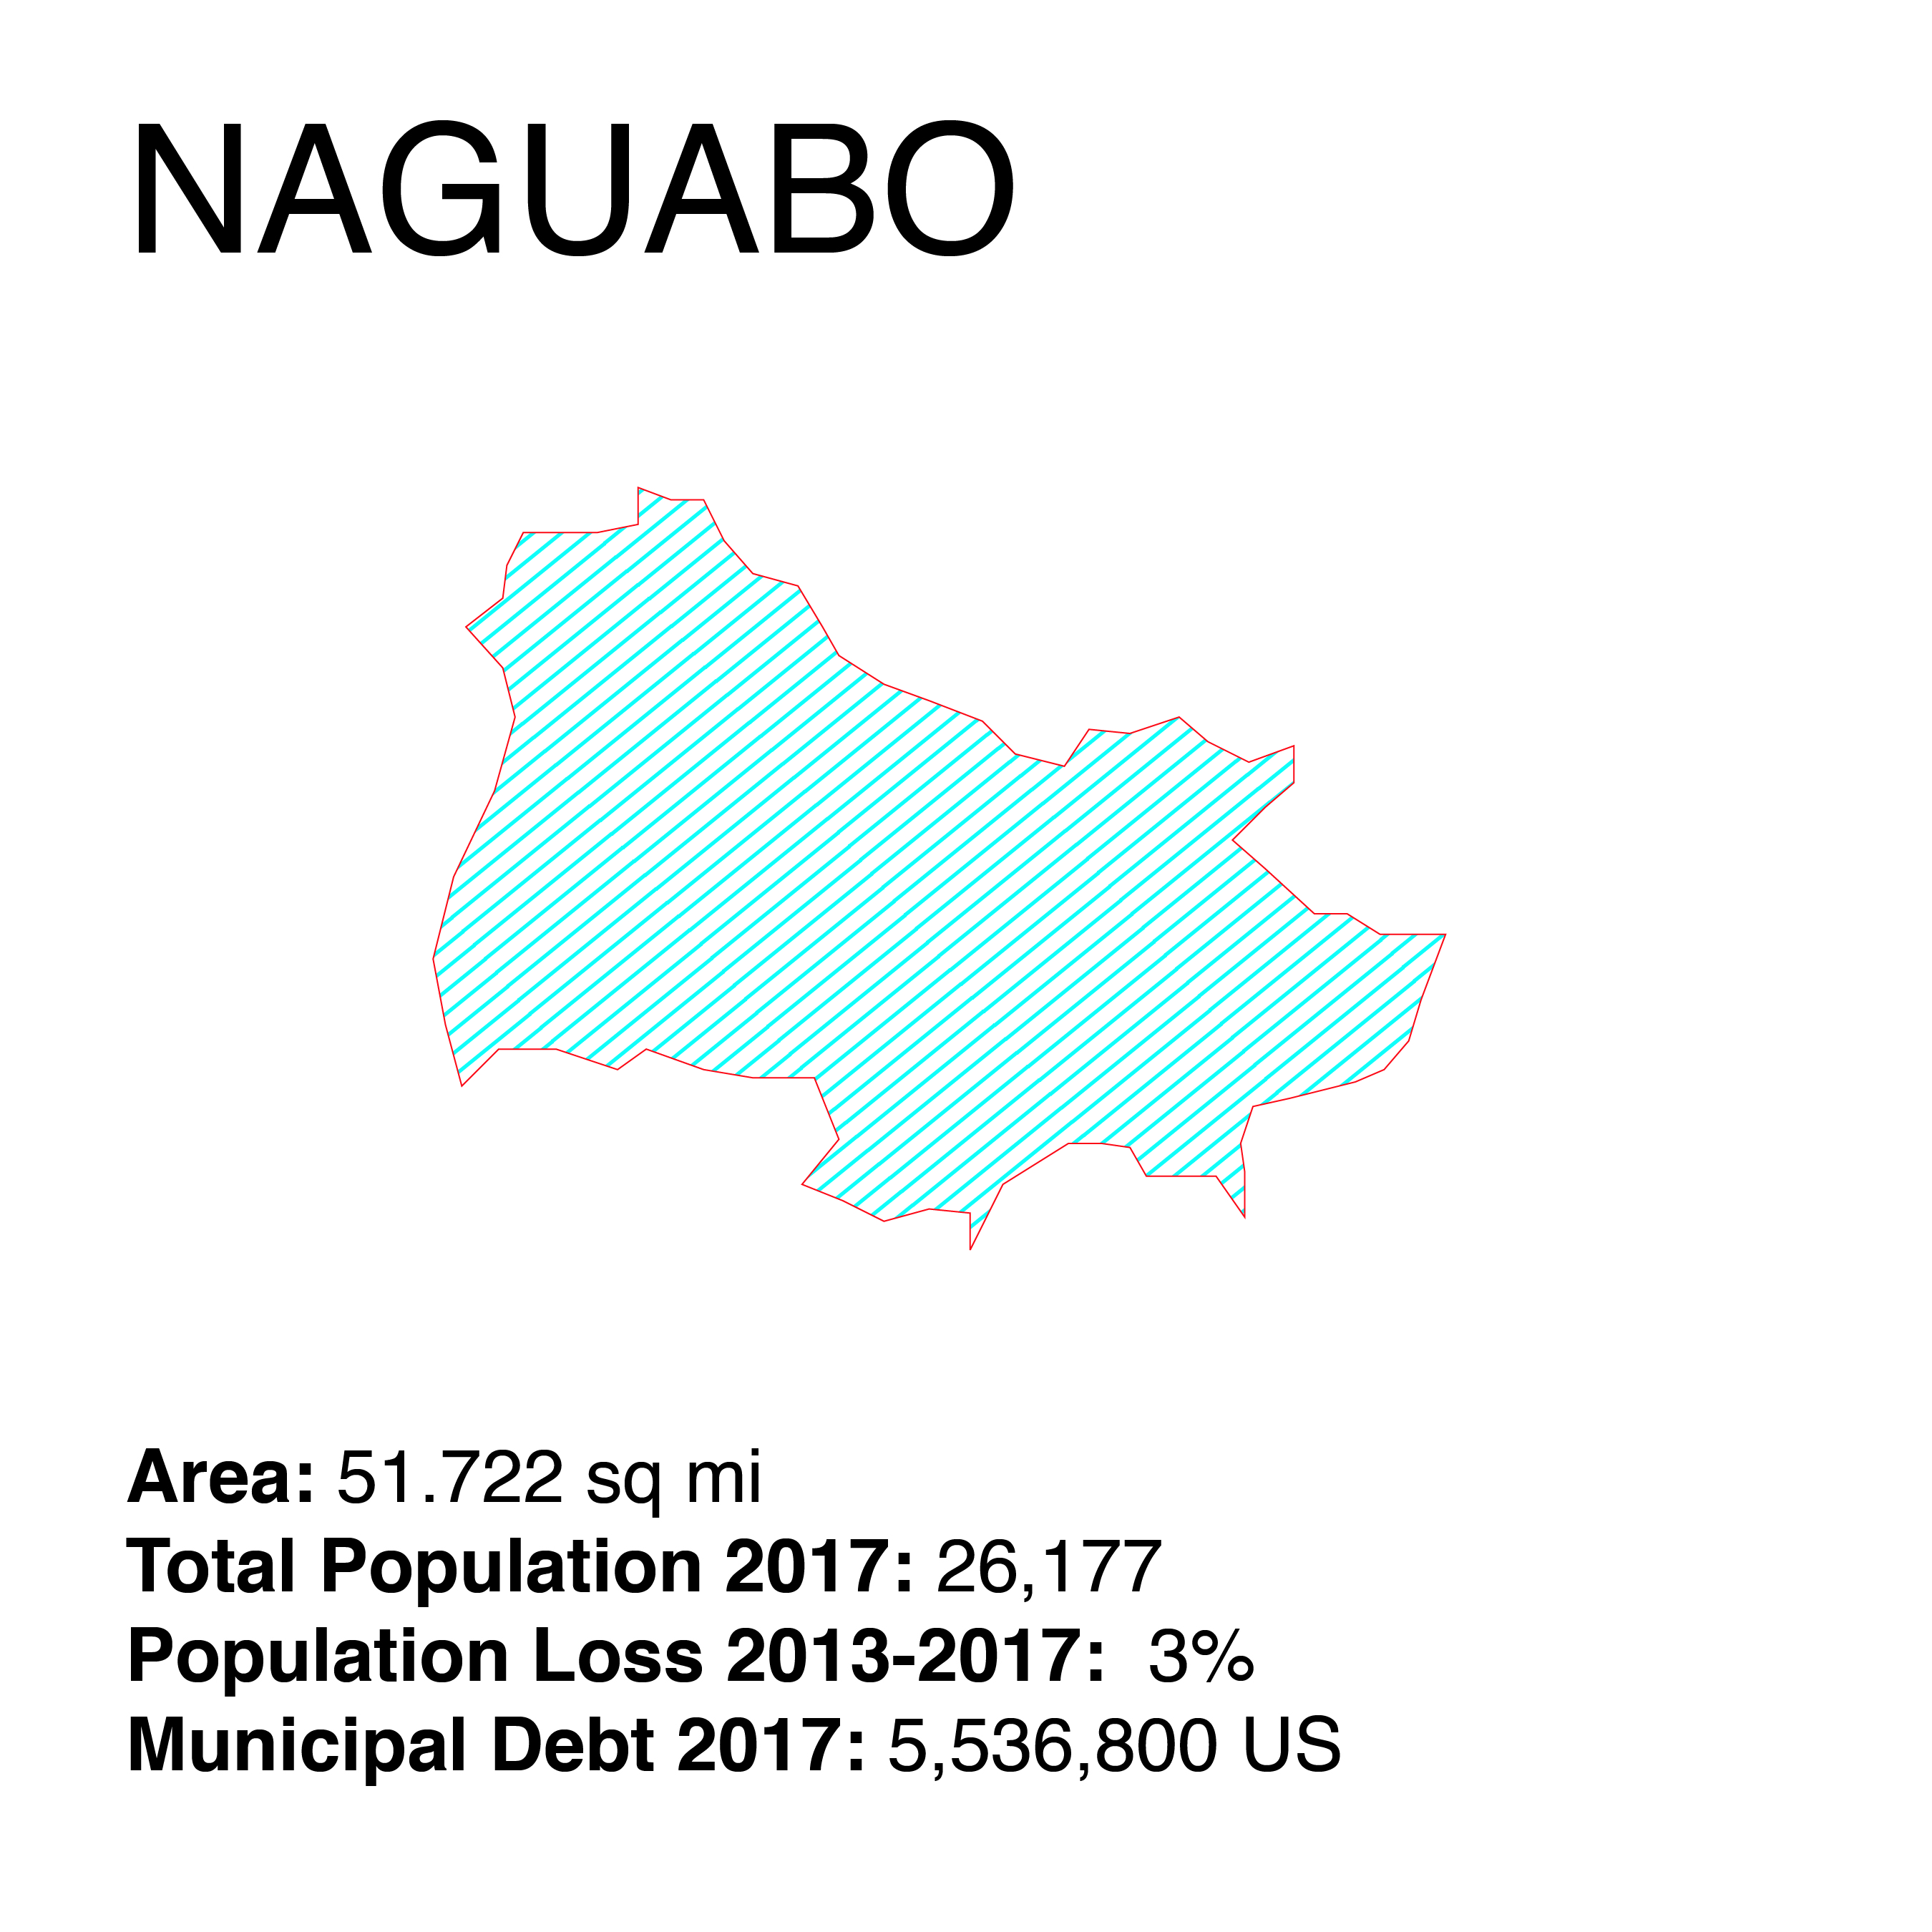
Naguabo is located in the southeast region of Puerto Rico.Since 2004, and based on law 1-2001, 9 barrios in Naguabo were designated as Special Communities (Comunidades especiales) in Puerto Rico to address high levels of poverty and lack of resources and opportunities; Relámpago, Río barrio, Santiago y Lima barrio, Daguao barrio, La Florida, Casco Urbano in barrio-pueblo, Húcares, Maizales, and Río Blanco. This town is known for it closesness to the tropical forest El Yunque to the extent that the town known as “El Pueblo de los Enchumbaos” in eglish “The Town of the Drenched Ones” given the amount of rivers and streams it contains, in addition to the amount of rain it receives constantly. Read more about Naguabo after María
References
-
El Nuevo Día (2016, September 21) Colapso total del sistema de la AEE en Puerto Rico. Accessed September 22, 2016. https://www.nesdis.noaa.gov/content/noaa-satellite-imagery-hurricane-jose-and-maria
-
Farber, D. A. (2018). Response and Recovery after Maria: Lessons for Disaster Law and Policy. Retrieved from https://papers.ssrn.com/abstract=3174466
-
Acevedo, N. (2018, September 18). A year after Hurricane Maria, Puerto Ricans rebuild amid setbacks. A Year after Hurricane Maria, Puerto RIcans Rebuild amid Setbacks. Retrieved from https://www.nbcnews.com/storyline/puerto-rico-crisis/year-after-hurricane-maria-puerto-ricans-rebuild-amid-setbacks-n907086
-
Alvarado León, G. (2019, June 2). Los municipios actualizan sus planes de mitigación. El Nuevo Dia. Retrieved from https://www.elnuevodia.com/noticias/locales/nota/losmunicipiosactualizansusplanesdemitigacion-2497113/
-
Bauzá, N. (2017, September 28). La comunidad en Punta Santiago sobrevive unida. El Nuevo Dia. Retrieved from https://www.elnuevodia.com/noticias/locales/nota/lacomunidadenpuntasantiagosobreviveunida-2361115/
-
Instituto de Estadísticas crea sección para facilitar datos sobre huracán María. (2017, October 5). Retrieved June 27, 2019, from Mi Puerto Rico Verde website: https://www.miprv.com/instituto-de-estadisticas-crea-seccion-para-facilitar-datos-sobre-huracan-maria/