School Closure Brings Community Rupture
“The world ended for us [when our neighborhood school closed]…this school brought together the core of the community. It was the only thing here to unite the community. The only thing.” - Felipe Velázquez, parent from Yabucoa
In the wake of Hurricane Maria, community leaders, teachers, and parents have accused the Puerto Rican government of using the island’s devastation as an excuse to push through measures closing hundreds of schools. Part of a series of austerity measures meant to offset debt and optimize resources, these closures were enacted without the consultation or approval of local stakeholders, namely those from low-income, underserved communities. In many instances, parents and teachers only found out about school closures on television or on social media a couple of weeks before the resumption of the semester. As the voices of these communities are drowned out and appropriated by politicians, corporations, and Washington interests, local networks of resilience are thrown into disarray. Though many locals see their neighborhood public schools as community centers that provide critical social support, grasstop actors only seem to see dilapidated, rapidly depopulating buildings that make very little fiscal sense keeping open. By silencing and delegitimizing the impact of local representatives in promoting inclusive, innovative social change, the grasstop actors have been able to control the narrative. Ultimately, the marginalized people protesting the new education policies have been presented by the state as obstacles in the way of Puerto Rico’s recovery.
Keeping this in mind, this project will dig beneath the government narrative to (A) identify the physical and social inequalities of school closure impact and to (B) compile a database that brings to light the concealed and resistance stories of those affected by the school closures. Most of the time such stories are presented, they are buried inside articles or journals and presented alongside the government’s positivist rhetoric. As such, the database will serve as a highly political tool that reasserts the voices of parents and teachers in the education space. Rather than allow government and private interests to insist that school closure are for the common good, the database will reclaim the agency of families and communities to tell their own understanding of what this common good should be.
School Closures for the 2018-19 School Year (red: closing schools, green: receiving schools)
Puerto Rico’s prolonged debt crisis had already triggered multiple waves of school closures since 2010, but the aftermath of Hurricane Maria inspired new, zealous efforts to reform the island’s school system. Just this year, 265 schools have been shut down, pushing the overwhelmingly low-income school system into greater uncertainty and preacarity. While the government insists that these closures are necessary to account for deteriorating infrastructure, shrinking enrollment, and budget shortfalls, each school closure represents a painful loss for its surrounding community. Parents rely on neighborhood schools to educate their kids close to home in an environment that is familiar to them. Teachers rely on parents—who they know well—to bolster learning at home. Students rely on an interconnected network of educators and family members for critical academic and social support. Each red dot on the maps above is, therefore, not just a school closure, but a symbol of a community of parents, teachers, and students severed.
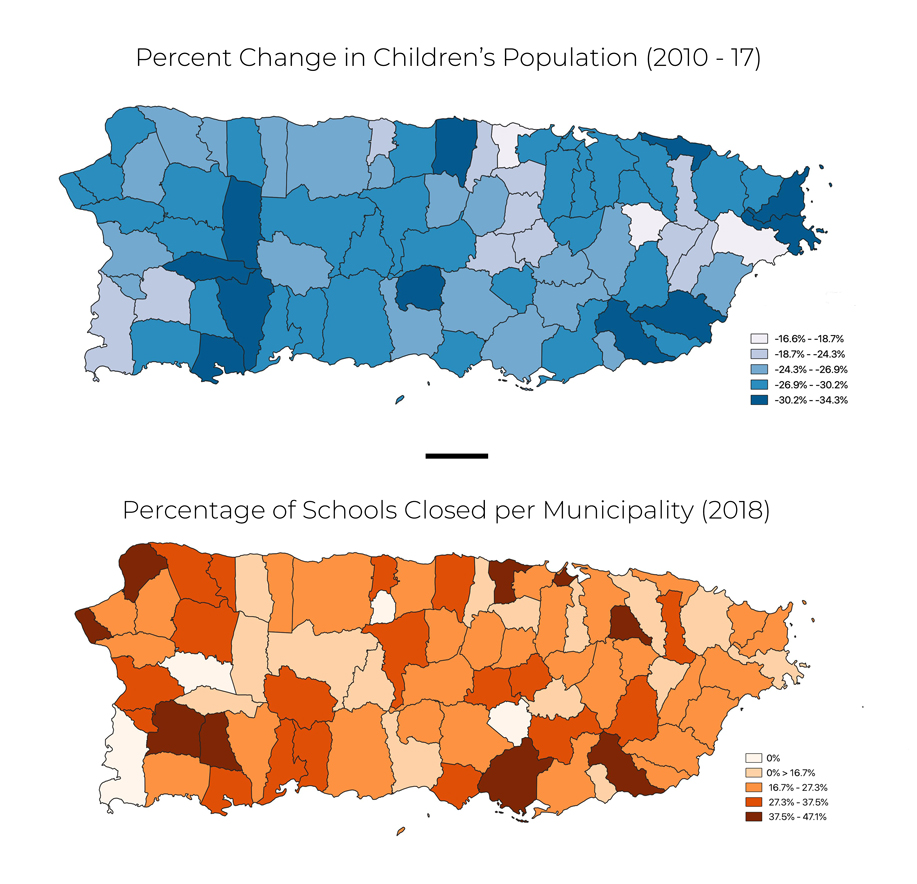
The two maps above represent the government’s main argument for closing down schools. By framing the debate around dwindling population numbers, officials have conveniently avoided talking about the broader processes that might affect school closure and vulnerability to school closure. Even though most educators and parents agree that some schools should be closed, they oppose the top-down way in which officials have decided to make cuts. Looking at other social and physical factors can support this opposition by highlighting the need for officials to work closely with communities to determine how best to mitigate the trauma of school closures.
Clearly, these two maps support the need for targeted community-centered approaches to analyzing vulnerability. Municipalities that had the largest negative percent change in children’s population were not necessarily, for instance, the ones with the highest percentage of schools closed. For some municipalities, like Dorado, the percentage of population loss is less than half of the percentage of schools closed, indicating that receiving schools in these areas might be experiencing overcrowding. The disparity between these two metrics is likely bven more stark when all schools that were closed since 2010 are taken into consideration.
SOCIAL FACTORS
*Top 5 most at-risk muncipalities and San Juan were chosen for each map. Data from the 2013-17 ACS Community Survey.
The three maps above consider different social factors that are present within the stories of Puerto Ricans affected by school closures. Though they don’t show a higher incidence of school closures in more at-risk municipalities, there are certain trends present that are worth exploring in greater depth. For poverty, there is a well-established difference between the percent of families living under the poverty line in rural and in urban communities. As San Juan’s census tract data shows, that difference also exists within cities; not only is there a stark divide between tracts on the level of poverty, there also appears to be a correlation between poverty and the amount of school closures in San Juan.
Estimates from the ACS Community Survey place municipal children’s disabilities on average around 10%, which is much less than the recorded 30% needing special needs across the entire public school system. It is therefore crucial for policymakers to first receive the proper demographic data before making decisions on whether to close schools with high concentrations of special needs children, who would likely benefit from schools closer to home in smaller settings. Parents of children with disabilities report that school closures have jeopardized the social progress of their children by uprooting their former local support networks.
PHYSICAL FACTORS
*Top 5 most at-risk muncipalities and San Juan were chosen for each map. Data from the 2013-17 ACS Community Survey.
Similarly to social factors, there are local trends present in physical factors that are worth exploring in greater detail. For average daily commute time, it is clear that the parents most at-risk to school closures are those in San Jose’s suburbs who have long commute times. While receiving schools might be nearby (as they are in Bayamón), parents or other caregivers will on average have to spend even more time on the road before and after work. In Caguas, for instance, new receiving schools may be 3-4 kilometers away. As promised school buses have yet to be implemented across the island, parents without cars are scrambling to find ways to get their children to school. In Loíza, where average distances to receiving schools is the highest in the country, more than 20% of families do not have a car, putting in jeopardy their children’s ability to attend school.
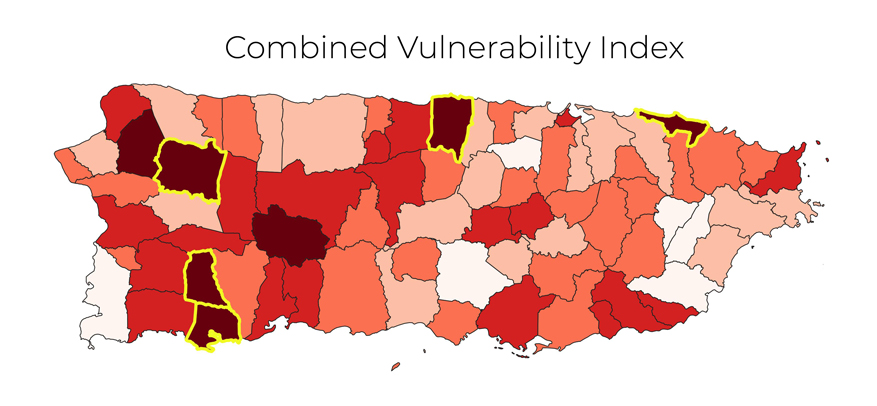
Top 5 most vulnerable municipalities to school closures, in order of their index score, Vega Baja, Guánica, Sabana Grande, San Sebastián, and Loíza.
Combining the three social factors, three physical factors, population loss, and percentage of schools shuttered created a new index that measures municipal vulnerability to school closures. While each of the factors alone did not show a higher incidence of school closures within more vulnerable municipalities, the municipalities with a higher than average combined vulnerability index (CVI) had a percentage of school closures on average 14% higher than municipalities that scored below average on CVI. Though this finding does lend credence to the need to measure vulnerability to school closures in an all-encompassing way, it is critical to develop this index further by listening to the stories of those affected by the closures. The preliminary database below geospatializes 22 published stories about the closures that were used to inform the metrics incorporated into the CVI.
PRELIMINARY STORY DATABASE
By listening to these concealed and resistance stories, the Puerto Rico Department of Education can better mitigate the trauma of the school closure crisis. While decisions regarding education are never easy to take, the government cannot continue implementing policy changes without consulting all stakeholders. Moreover, for teachers, parents, and students, voicing their stories is not only important for constructing broader counter-narratives, but for strengthening their group wholeness—what can be described as the emotional, spiritual, and relational resources that marginalized peoples draw on in their struggles against repression. While positivist data appears to tell a clear picture, it relies on proving or disproving certain experiences, which detaches them from the weight these experiences hold in the lives of individuals or small groups. The experiences of school-affected families cannot be disproven with the experiences of others or with population statistics from the Department of Education—they exist either way and it is, therefore, critical to acknowledge and account for them.
REFERENCES
-
ACS Community Survey 5 Year Estimate, 2013-2017
-
Arduengo, Ricardo, Monique Dols, Monique Dols, Monique Dols, Henry A. Giroux, Gillian Russom, Amanda Marcotte, and AFP / Getty Images. “Standing Against Privatization: Puerto Rico’s Teachers Strike.” Truthout.
-
Campbell, Alexia Fernández, and Rebecca Kiger. “About a Quarter of Puerto Rico’s Schools Are Shutting Down. Here’s a Look inside One.” Vox. June 15, 2018.
-
Gurney, Kyra. “Hurricane Maria Took Everything but Their Neighborhood School. Now, Even That Is Gone.” Miamiherald. November 29, 2018.
-
Kirk, Mimi, Mimi Kirk, and CityLab. “Puerto Rico’s Struggling Schools Face Privatization.” CityLab. March 01, 2018.
-
Mazzei, Patricia. “Puerto Rico’s Schools Are in Tumult, and Not Just Because of Hurricane Maria.” The New York Times. June 01, 2018.
-
Ujifusa, Andrew. “How Puerto Rico’s Educators See Their Schools a Year After Hurricane Maria.” Education Week.